Stock Analysis
- Mexico
- /
- Hospitality
- /
- BMV:CMR B
CMR. de (BMV:CMRB shareholders incur further losses as stock declines 10% this week, taking five-year losses to 55%


Statistically speaking, long term investing is a profitable endeavour. But that doesn't mean long term investors can avoid big losses. For example, after five long years the CMR, S.A.B. de C.V. (BMV:CMRB) share price is a whole 60% lower. That is extremely sub-optimal, to say the least. And some of the more recent buyers are probably worried, too, with the stock falling 39% in the last year. Shareholders have had an even rougher run lately, with the share price down 28% in the last 90 days. We note that the company has reported results fairly recently; and the market is hardly delighted. You can check out the latest numbers in our company report.
If the past week is anything to go by, investor sentiment for CMR. de isn't positive, so let's see if there's a mismatch between fundamentals and the share price.
Check out our latest analysis for CMR. de
In his essay The Superinvestors of Graham-and-Doddsville Warren Buffett described how share prices do not always rationally reflect the value of a business. One imperfect but simple way to consider how the market perception of a company has shifted is to compare the change in the earnings per share (EPS) with the share price movement.
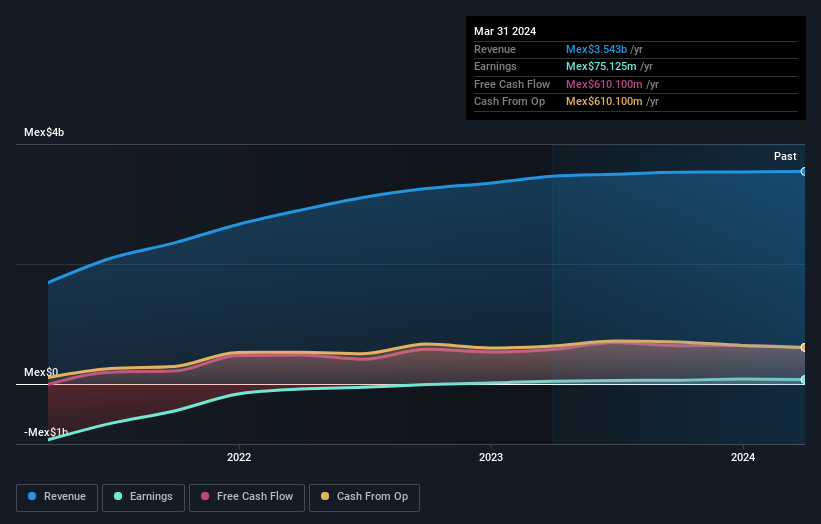
During five years of share price growth, CMR. de moved from a loss to profitability. Most would consider that to be a good thing, so it's counter-intuitive to see the share price declining. Other metrics might give us a better handle on how its value is changing over time.
Revenue is actually up 7.3% over the time period. So it seems one might have to take closer look at the fundamentals to understand why the share price languishes. After all, there may be an opportunity.
The graphic below depicts how earnings and revenue have changed over time (unveil the exact values by clicking on the image).
You can see how its balance sheet has strengthened (or weakened) over time in this free interactive graphic.
What About The Total Shareholder Return (TSR)?
We've already covered CMR. de's share price action, but we should also mention its total shareholder return (TSR). The TSR is a return calculation that accounts for the value of cash dividends (assuming that any dividend received was reinvested) and the calculated value of any discounted capital raisings and spin-offs. We note that CMR. de's TSR, at -55% is higher than its share price return of -60%. When you consider it hasn't been paying a dividend, this data suggests shareholders have benefitted from a spin-off, or had the opportunity to acquire attractively priced shares in a discounted capital raising.
A Different Perspective
CMR. de shareholders are down 39% for the year, but the market itself is up 5.2%. However, keep in mind that even the best stocks will sometimes underperform the market over a twelve month period. Unfortunately, last year's performance may indicate unresolved challenges, given that it was worse than the annualised loss of 9% over the last half decade. We realise that Baron Rothschild has said investors should "buy when there is blood on the streets", but we caution that investors should first be sure they are buying a high quality business. It's always interesting to track share price performance over the longer term. But to understand CMR. de better, we need to consider many other factors. To that end, you should learn about the 2 warning signs we've spotted with CMR. de (including 1 which is potentially serious) .
But note: CMR. de may not be the best stock to buy. So take a peek at this free list of interesting companies with past earnings growth (and further growth forecast).
Please note, the market returns quoted in this article reflect the market weighted average returns of stocks that currently trade on Mexican exchanges.
Valuation is complex, but we're helping make it simple.
Find out whether CMR. de is potentially over or undervalued by checking out our comprehensive analysis, which includes fair value estimates, risks and warnings, dividends, insider transactions and financial health.
View the Free AnalysisHave feedback on this article? Concerned about the content? Get in touch with us directly. Alternatively, email editorial-team (at) simplywallst.com.
This article by Simply Wall St is general in nature. We provide commentary based on historical data and analyst forecasts only using an unbiased methodology and our articles are not intended to be financial advice. It does not constitute a recommendation to buy or sell any stock, and does not take account of your objectives, or your financial situation. We aim to bring you long-term focused analysis driven by fundamental data. Note that our analysis may not factor in the latest price-sensitive company announcements or qualitative material. Simply Wall St has no position in any stocks mentioned.
About BMV:CMR B
Solid track record and good value.
