
Advertisement
Should You Like Accel, S.A.B. de C.V.’s (BMV:ACCELSAB) High Return On Capital Employed?

Today we'll evaluate Accel, S.A.B. de C.V. (BMV:ACCELSAB) to determine whether it could have potential as an investment idea. Specifically, we're going to calculate its Return On Capital Employed (ROCE), in the hopes of getting some insight into the business.
First, we'll go over how we calculate ROCE. Next, we'll compare it to others in its industry. Last but not least, we'll look at what impact its current liabilities have on its ROCE.
Return On Capital Employed (ROCE): What is it?
ROCE is a measure of a company's yearly pre-tax profit (its return), relative to the capital employed in the business. All else being equal, a better business will have a higher ROCE. Ultimately, it is a useful but imperfect metric. Renowned investment researcher Michael Mauboussin has suggested that a high ROCE can indicate that 'one dollar invested in the company generates value of more than one dollar'.
How Do You Calculate Return On Capital Employed?
Analysts use this formula to calculate return on capital employed:
Return on Capital Employed = Earnings Before Interest and Tax (EBIT) ÷ (Total Assets - Current Liabilities)
Or for Accel. de:
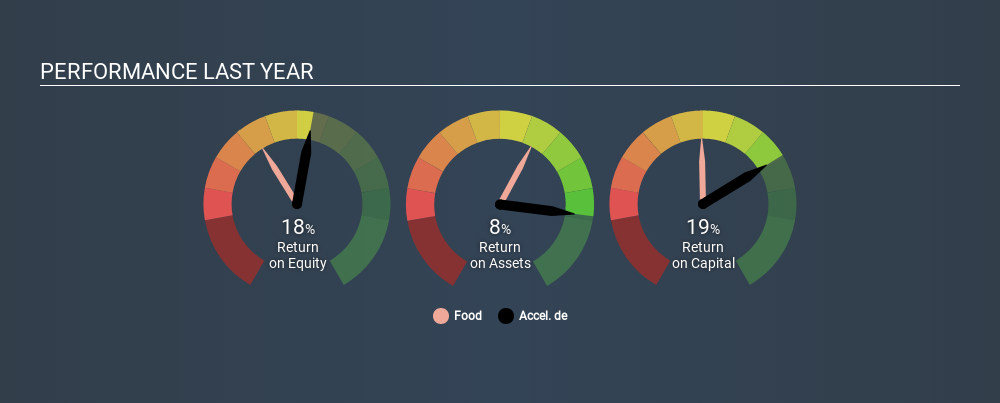
0.19 = Mex$1.1b ÷ (Mex$7.4b - Mex$1.7b) (Based on the trailing twelve months to September 2019.)
Therefore, Accel. de has an ROCE of 19%.
See our latest analysis for Accel. de
Does Accel. de Have A Good ROCE?
When making comparisons between similar businesses, investors may find ROCE useful. Using our data, we find that Accel. de's ROCE is meaningfully better than the 11% average in the Food industry. I think that's good to see, since it implies the company is better than other companies at making the most of its capital. Independently of how Accel. de compares to its industry, its ROCE in absolute terms appears decent, and the company may be worthy of closer investigation.
Our data shows that Accel. de currently has an ROCE of 19%, compared to its ROCE of 12% 3 years ago. This makes us think the business might be improving. You can click on the image below to see (in greater detail) how Accel. de's past growth compares to other companies.
Remember that this metric is backwards looking - it shows what has happened in the past, and does not accurately predict the future. ROCE can be misleading for companies in cyclical industries, with returns looking impressive during the boom times, but very weak during the busts. ROCE is only a point-in-time measure. How cyclical is Accel. de? You can see for yourself by looking at this free graph of past earnings, revenue and cash flow.
Accel. de's Current Liabilities And Their Impact On Its ROCE
Liabilities, such as supplier bills and bank overdrafts, are referred to as current liabilities if they need to be paid within 12 months. Due to the way ROCE is calculated, a high level of current liabilities makes a company look as though it has less capital employed, and thus can (sometimes unfairly) boost the ROCE. To check the impact of this, we calculate if a company has high current liabilities relative to its total assets.
Accel. de has total liabilities of Mex$1.7b and total assets of Mex$7.4b. As a result, its current liabilities are equal to approximately 23% of its total assets. Current liabilities are minimal, limiting the impact on ROCE.
What We Can Learn From Accel. de's ROCE
This is good to see, and with a sound ROCE, Accel. de could be worth a closer look. Accel. de looks strong on this analysis, but there are plenty of other companies that could be a good opportunity . Here is a free list of companies growing earnings rapidly.
For those who like to find winning investments this free list of growing companies with recent insider purchasing, could be just the ticket.
If you spot an error that warrants correction, please contact the editor at editorial-team@simplywallst.com. This article by Simply Wall St is general in nature. It does not constitute a recommendation to buy or sell any stock, and does not take account of your objectives, or your financial situation. Simply Wall St has no position in the stocks mentioned.
We aim to bring you long-term focused research analysis driven by fundamental data. Note that our analysis may not factor in the latest price-sensitive company announcements or qualitative material. Thank you for reading.
About BMV:ACCELSA B
Accel. de
Provides manufacturing and logistics services in Mexico and the United States.
Mediocre balance sheet with poor track record.
Market Insights


Advertisement
Community Narratives
The Future of Drug Testing? Fingerprint Tech Shows Serious Promise
Fair Value US$2.98|40.3% undervalued
JO
Community Contributor
Suncorp’s Next Chapter: Insurance-Only and Ready to Grow
Fair Value AU$22.83|7.9% undervalued
RO
Community Contributor
Thyssenkrupp Nucera Will Achieve Double-Digit Profits by 2030 Boosted by Hydrogen Growth
Fair Value €14.40|31.6% undervalued
CH
Community Contributor
Tesla’s Nvidia Moment – The AI & Robotics Inflection Point
Fair Value US$359.72|12.3% undervalued
BL
Community Contributor