
Legendary fund manager Li Lu (who Charlie Munger backed) once said, 'The biggest investment risk is not the volatility of prices, but whether you will suffer a permanent loss of capital.' So it might be obvious that you need to consider debt, when you think about how risky any given stock is, because too much debt can sink a company. As with many other companies RLH Properties, S.A.B. de C.V. (BMV:RLHA) makes use of debt. But the more important question is: how much risk is that debt creating?
Why Does Debt Bring Risk?
Debt and other liabilities become risky for a business when it cannot easily fulfill those obligations, either with free cash flow or by raising capital at an attractive price. In the worst case scenario, a company can go bankrupt if it cannot pay its creditors. However, a more frequent (but still costly) occurrence is where a company must issue shares at bargain-basement prices, permanently diluting shareholders, just to shore up its balance sheet. Of course, the upside of debt is that it often represents cheap capital, especially when it replaces dilution in a company with the ability to reinvest at high rates of return. The first step when considering a company's debt levels is to consider its cash and debt together.
Check out our latest analysis for RLH Properties. de
What Is RLH Properties. de's Debt?
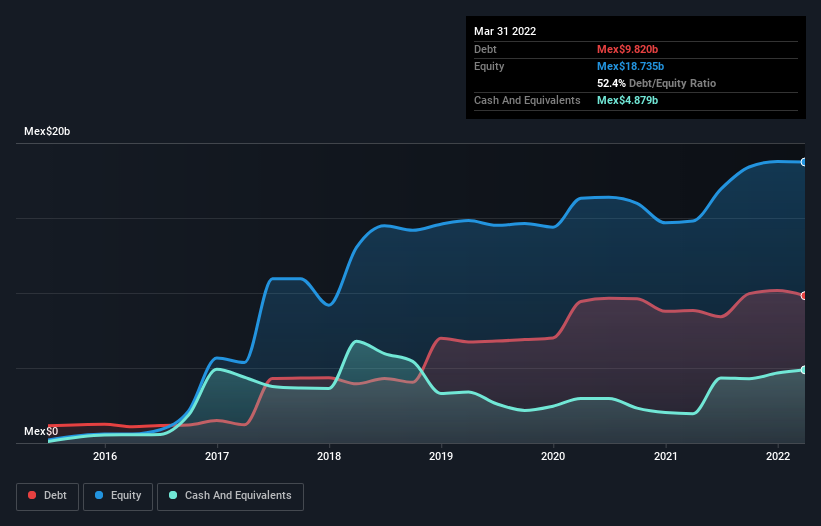
You can click the graphic below for the historical numbers, but it shows that as of March 2022 RLH Properties. de had Mex$9.82b of debt, an increase on Mex$8.83b, over one year. However, it does have Mex$4.88b in cash offsetting this, leading to net debt of about Mex$4.94b.
How Strong Is RLH Properties. de's Balance Sheet?
We can see from the most recent balance sheet that RLH Properties. de had liabilities of Mex$3.49b falling due within a year, and liabilities of Mex$11.5b due beyond that. Offsetting these obligations, it had cash of Mex$4.88b as well as receivables valued at Mex$1.05b due within 12 months. So its liabilities total Mex$9.11b more than the combination of its cash and short-term receivables.
While this might seem like a lot, it is not so bad since RLH Properties. de has a market capitalization of Mex$19.0b, and so it could probably strengthen its balance sheet by raising capital if it needed to. But we definitely want to keep our eyes open to indications that its debt is bringing too much risk.
In order to size up a company's debt relative to its earnings, we calculate its net debt divided by its earnings before interest, tax, depreciation, and amortization (EBITDA) and its earnings before interest and tax (EBIT) divided by its interest expense (its interest cover). Thus we consider debt relative to earnings both with and without depreciation and amortization expenses.
While we wouldn't worry about RLH Properties. de's net debt to EBITDA ratio of 4.7, we think its super-low interest cover of 1.7 times is a sign of high leverage. In large part that's due to the company's significant depreciation and amortisation charges, which arguably mean its EBITDA is a very generous measure of earnings, and its debt may be more of a burden than it first appears. It seems clear that the cost of borrowing money is negatively impacting returns for shareholders, of late. However, the silver lining was that RLH Properties. de achieved a positive EBIT of Mex$486m in the last twelve months, an improvement on the prior year's loss. There's no doubt that we learn most about debt from the balance sheet. But you can't view debt in total isolation; since RLH Properties. de will need earnings to service that debt. So if you're keen to discover more about its earnings, it might be worth checking out this graph of its long term earnings trend.
But our final consideration is also important, because a company cannot pay debt with paper profits; it needs cold hard cash. So it's worth checking how much of the earnings before interest and tax (EBIT) is backed by free cash flow. Looking at the most recent year, RLH Properties. de recorded free cash flow of 24% of its EBIT, which is weaker than we'd expect. That's not great, when it comes to paying down debt.
Our View
On the face of it, RLH Properties. de's net debt to EBITDA left us tentative about the stock, and its interest cover was no more enticing than the one empty restaurant on the busiest night of the year. But at least its EBIT growth rate is not so bad. Looking at the balance sheet and taking into account all these factors, we do believe that debt is making RLH Properties. de stock a bit risky. That's not necessarily a bad thing, but we'd generally feel more comfortable with less leverage. When analysing debt levels, the balance sheet is the obvious place to start. But ultimately, every company can contain risks that exist outside of the balance sheet. Case in point: We've spotted 1 warning sign for RLH Properties. de you should be aware of.
If, after all that, you're more interested in a fast growing company with a rock-solid balance sheet, then check out our list of net cash growth stocks without delay.
The New Payments ETF Is Live on NASDAQ:
Money is moving to real-time rails, and a newly listed ETF now gives investors direct exposure. Fast settlement. Institutional custody. Simple access.
Explore how this launch could reshape portfolios
Sponsored ContentNew: AI Stock Screener & Alerts
Our new AI Stock Screener scans the market every day to uncover opportunities.
• Dividend Powerhouses (3%+ Yield)
• Undervalued Small Caps with Insider Buying
• High growth Tech and AI Companies
Or build your own from over 50 metrics.
Have feedback on this article? Concerned about the content? Get in touch with us directly. Alternatively, email editorial-team (at) simplywallst.com.
This article by Simply Wall St is general in nature. We provide commentary based on historical data and analyst forecasts only using an unbiased methodology and our articles are not intended to be financial advice. It does not constitute a recommendation to buy or sell any stock, and does not take account of your objectives, or your financial situation. We aim to bring you long-term focused analysis driven by fundamental data. Note that our analysis may not factor in the latest price-sensitive company announcements or qualitative material. Simply Wall St has no position in any stocks mentioned.
About BMV:RLH A
RLH Properties. de
Engages in the acquisition, development, and management of hotels and resorts.
Low risk with questionable track record.
Market Insights

Weekly Picks

Early mover in a fast growing industry. Likely to experience share price volatility as they scale


A case for CA$31.80 (undiluted), aka 8,616% upside from CA$0.37 (an 86 bagger!).


Moderation and Stabilisation: HOLD: Fair Price based on a 4-year Cycle is $12.08
Recently Updated Narratives


Title: Market Sentiment Is Dead Wrong — Here's Why PSEC Deserves a Second Look


An amazing opportunity to potentially get a 100 bagger

Amazon: Why the World’s Biggest Platform Still Runs on Invisible Economics
Popular Narratives


Crazy Undervalued 42 Baggers Silver Play (Active & Running Mine)


MicroVision will explode future revenue by 380.37% with a vision towards success


NVDA: Expanding AI Demand Will Drive Major Data Center Investments Through 2026
Trending Discussion
