
Advertisement
- Mexico
- /
- Hospitality
- /
- BMV:RLH A
Earnings Tell The Story For RLH Properties, S.A.B. de C.V. (BMV:RLHA) As Its Stock Soars 27%
RLH Properties, S.A.B. de C.V. (BMV:RLHA) shareholders would be excited to see that the share price has had a great month, posting a 27% gain and recovering from prior weakness. While recent buyers may be laughing, long-term holders might not be as pleased since the recent gain only brings the stock back to where it started a year ago.
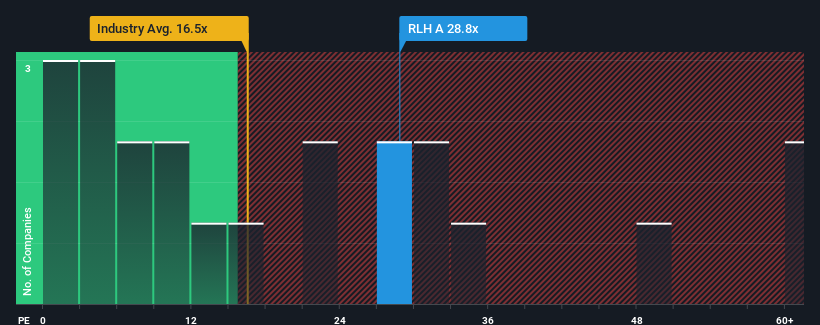
Following the firm bounce in price, RLH Properties. de's price-to-earnings (or "P/E") ratio of 28.8x might make it look like a strong sell right now compared to the market in Mexico, where around half of the companies have P/E ratios below 12x and even P/E's below 7x are quite common. Although, it's not wise to just take the P/E at face value as there may be an explanation why it's so lofty.
RLH Properties. de certainly has been doing a great job lately as it's been growing earnings at a really rapid pace. The P/E is probably high because investors think this strong earnings growth will be enough to outperform the broader market in the near future. If not, then existing shareholders might be a little nervous about the viability of the share price.
See our latest analysis for RLH Properties. de
Is There Enough Growth For RLH Properties. de?
The only time you'd be truly comfortable seeing a P/E as steep as RLH Properties. de's is when the company's growth is on track to outshine the market decidedly.
Retrospectively, the last year delivered an exceptional 290% gain to the company's bottom line. The strong recent performance means it was also able to grow EPS by 64% in total over the last three years. Accordingly, shareholders would have probably welcomed those medium-term rates of earnings growth.
Comparing that to the market, which is only predicted to deliver 16% growth in the next 12 months, the company's momentum is stronger based on recent medium-term annualised earnings results.
With this information, we can see why RLH Properties. de is trading at such a high P/E compared to the market. Presumably shareholders aren't keen to offload something they believe will continue to outmanoeuvre the bourse.

The Bottom Line On RLH Properties. de's P/E
Shares in RLH Properties. de have built up some good momentum lately, which has really inflated its P/E. While the price-to-earnings ratio shouldn't be the defining factor in whether you buy a stock or not, it's quite a capable barometer of earnings expectations.
As we suspected, our examination of RLH Properties. de revealed its three-year earnings trends are contributing to its high P/E, given they look better than current market expectations. At this stage investors feel the potential for a deterioration in earnings isn't great enough to justify a lower P/E ratio. If recent medium-term earnings trends continue, it's hard to see the share price falling strongly in the near future under these circumstances.
Before you take the next step, you should know about the 2 warning signs for RLH Properties. de that we have uncovered.
If P/E ratios interest you, you may wish to see this free collection of other companies with strong earnings growth and low P/E ratios.
New: AI Stock Screener & Alerts
Our new AI Stock Screener scans the market every day to uncover opportunities.
• Dividend Powerhouses (3%+ Yield)
• Undervalued Small Caps with Insider Buying
• High growth Tech and AI Companies
Or build your own from over 50 metrics.
Have feedback on this article? Concerned about the content? Get in touch with us directly. Alternatively, email editorial-team (at) simplywallst.com.
This article by Simply Wall St is general in nature. We provide commentary based on historical data and analyst forecasts only using an unbiased methodology and our articles are not intended to be financial advice. It does not constitute a recommendation to buy or sell any stock, and does not take account of your objectives, or your financial situation. We aim to bring you long-term focused analysis driven by fundamental data. Note that our analysis may not factor in the latest price-sensitive company announcements or qualitative material. Simply Wall St has no position in any stocks mentioned.
About BMV:RLH A
RLH Properties. de
Engages in the acquisition, development, and management of hotels and resorts.
Low risk with questionable track record.
Market Insights

Advertisement
Community Narratives
MicroVision will explode future revenue by 380.37% with a vision towards success
Fair Value US$60|98.4% undervalued
TH
Community Contributor
The Indispensable Artery for a New North American Economy
Fair Value CA$132.87|0.7% overvalued
TI
Community Contributor
Recently Updated Narratives
BE


Bejgal on MINISO Group Holding ·
MINISO's fair value is projected at 26.69 with an anticipated PE ratio shift of 20x
Fair Value:US$28.1829.5% undervalued
46 followersusers have followed this narrative
3 commentsusers have commented on this narrative
0 likesusers have liked this narrative
BE

Bejgal on Fiverr International ·
Fiverr International will transform the freelance industry with AI-powered growth
Fair Value:US$36.8143.1% undervalued
78 followersusers have followed this narrative
7 commentsusers have commented on this narrative
0 likesusers have liked this narrative
CE

cementafriend on Constellation Energy ·
Constellation Energy Dividends and Growth
Fair Value:US$348.054.7% overvalued
2 followersusers have followed this narrative
0 commentsusers have commented on this narrative
0 likesusers have liked this narrative
Popular Narratives
TH

TheWallstreetKing on MicroVision ·
MicroVision will explode future revenue by 380.37% with a vision towards success
Fair Value:US$6098.4% undervalued
108 followersusers have followed this narrative
10 commentsusers have commented on this narrative
21 likesusers have liked this narrative
AN


AnalystConsensusTarget on NVIDIA ·
NVDA: Expanding AI Demand Will Drive Major Data Center Investments Through 2026
Fair Value:US$250.3929.3% undervalued
936 followersusers have followed this narrative
6 commentsusers have commented on this narrative
24 likesusers have liked this narrative
OS


oscargarcia on Alphabet ·
The company that turned a verb into a global necessity and basically runs the modern internet, digital ads, smartphones, maps, and AI.
Fair Value:US$3405.8% undervalued
144 followersusers have followed this narrative
6 commentsusers have commented on this narrative
18 likesusers have liked this narrative