
Advertisement
- South Korea
- /
- Electronic Equipment and Components
- /
- KOSE:A105840
Is Woojin (KRX:105840) Using Too Much Debt?
Legendary fund manager Li Lu (who Charlie Munger backed) once said, 'The biggest investment risk is not the volatility of prices, but whether you will suffer a permanent loss of capital.' So it might be obvious that you need to consider debt, when you think about how risky any given stock is, because too much debt can sink a company. Importantly, Woojin Inc. (KRX:105840) does carry debt. But the real question is whether this debt is making the company risky.
Why Does Debt Bring Risk?
Generally speaking, debt only becomes a real problem when a company can't easily pay it off, either by raising capital or with its own cash flow. Ultimately, if the company can't fulfill its legal obligations to repay debt, shareholders could walk away with nothing. However, a more common (but still painful) scenario is that it has to raise new equity capital at a low price, thus permanently diluting shareholders. By replacing dilution, though, debt can be an extremely good tool for businesses that need capital to invest in growth at high rates of return. When we examine debt levels, we first consider both cash and debt levels, together.
How Much Debt Does Woojin Carry?
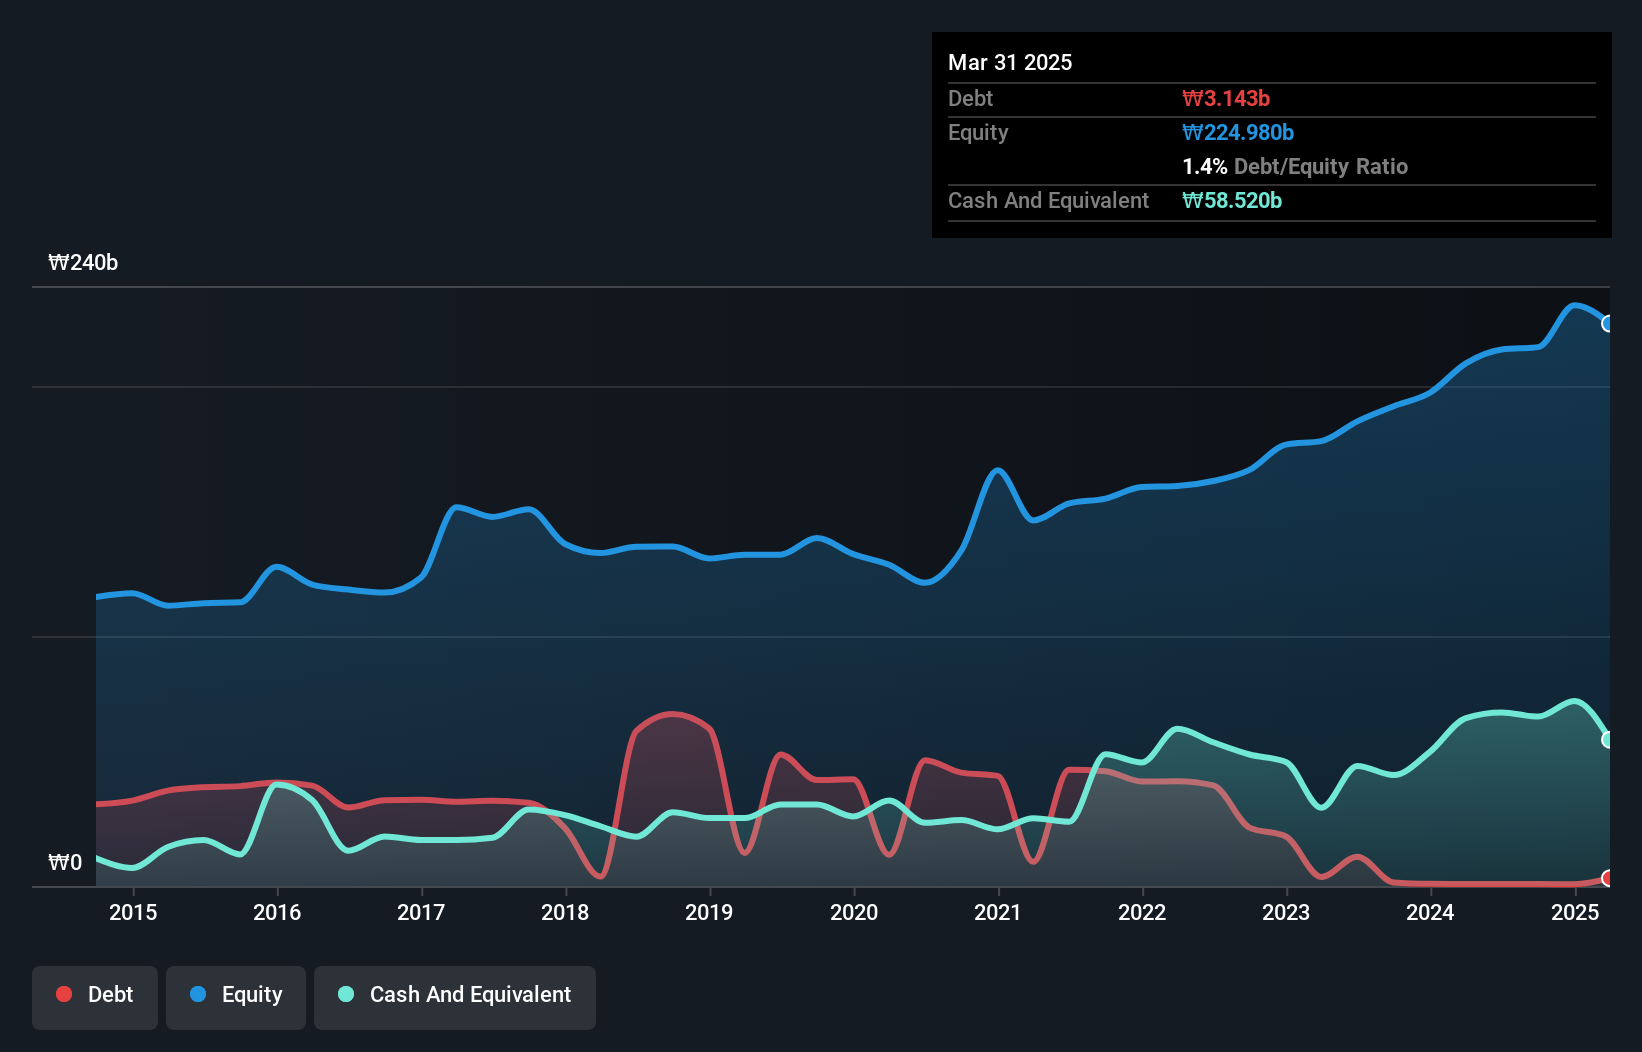
As you can see below, at the end of March 2025, Woojin had ₩3.14b of debt, up from ₩815.4m a year ago. Click the image for more detail. However, it does have ₩58.5b in cash offsetting this, leading to net cash of ₩55.4b.
How Healthy Is Woojin's Balance Sheet?
Zooming in on the latest balance sheet data, we can see that Woojin had liabilities of ₩24.4b due within 12 months and liabilities of ₩17.5b due beyond that. On the other hand, it had cash of ₩58.5b and ₩9.95b worth of receivables due within a year. So it actually has ₩26.6b more liquid assets than total liabilities.
This surplus suggests that Woojin has a conservative balance sheet, and could probably eliminate its debt without much difficulty. Simply put, the fact that Woojin has more cash than debt is arguably a good indication that it can manage its debt safely.
View our latest analysis for Woojin
It is just as well that Woojin's load is not too heavy, because its EBIT was down 39% over the last year. When a company sees its earnings tank, it can sometimes find its relationships with its lenders turn sour. There's no doubt that we learn most about debt from the balance sheet. But you can't view debt in total isolation; since Woojin will need earnings to service that debt. So if you're keen to discover more about its earnings, it might be worth checking out this graph of its long term earnings trend.
But our final consideration is also important, because a company cannot pay debt with paper profits; it needs cold hard cash. While Woojin has net cash on its balance sheet, it's still worth taking a look at its ability to convert earnings before interest and tax (EBIT) to free cash flow, to help us understand how quickly it is building (or eroding) that cash balance. Over the most recent three years, Woojin recorded free cash flow worth 66% of its EBIT, which is around normal, given free cash flow excludes interest and tax. This cold hard cash means it can reduce its debt when it wants to.
Summing Up
While it is always sensible to investigate a company's debt, in this case Woojin has ₩55.4b in net cash and a decent-looking balance sheet. So we are not troubled with Woojin's debt use. When analysing debt levels, the balance sheet is the obvious place to start. But ultimately, every company can contain risks that exist outside of the balance sheet. Be aware that Woojin is showing 3 warning signs in our investment analysis , you should know about...
Of course, if you're the type of investor who prefers buying stocks without the burden of debt, then don't hesitate to discover our exclusive list of net cash growth stocks, today.
Valuation is complex, but we're here to simplify it.
Discover if Woojin might be undervalued or overvalued with our detailed analysis, featuring fair value estimates, potential risks, dividends, insider trades, and its financial condition.
Access Free AnalysisHave feedback on this article? Concerned about the content? Get in touch with us directly. Alternatively, email editorial-team (at) simplywallst.com.
This article by Simply Wall St is general in nature. We provide commentary based on historical data and analyst forecasts only using an unbiased methodology and our articles are not intended to be financial advice. It does not constitute a recommendation to buy or sell any stock, and does not take account of your objectives, or your financial situation. We aim to bring you long-term focused analysis driven by fundamental data. Note that our analysis may not factor in the latest price-sensitive company announcements or qualitative material. Simply Wall St has no position in any stocks mentioned.
About KOSE:A105840
Woojin
Engages in the developing and manufacturing of industrial measuring instruments in South Korea.
Flawless balance sheet with proven track record.
Market Insights

Advertisement
Weekly Picks
FA

FAI on Arabian Internet and Communication Services ·
Solutions by stc: 34% Upside in Saudi's Digital Transformation Leader
Fair Value:ر.س342.2335.3% undervalued
9 followersusers have followed this narrative
1 commentusers have commented on this narrative
3 likesusers have liked this narrative
RO


RobertoAllende on NVIDIA ·
The AI Infrastructure Giant Grows Into Its Valuation
Fair Value:US$345.0747.9% undervalued
27 followersusers have followed this narrative
28 commentsusers have commented on this narrative
21 likesusers have liked this narrative
Recently Updated Narratives
AB
Abc on Global X Etfs Icav - Global X Silver Miners Ucits ETF ·
Many trends acting at the same time
Fair Value:€10068.5% undervalued
1 followerusers have followed this narrative
0 commentsusers have commented on this narrative
0 likesusers have liked this narrative
NI


niteco on Texas Instruments ·
Engineered for Stability. Positioned for Growth.
Fair Value:US$314.4446.5% undervalued
2 followersusers have followed this narrative
0 commentsusers have commented on this narrative
0 likesusers have liked this narrative
MA


MarkoVT on Applied Digital ·
Staggered by dilution; positions for growth
Fair Value:US$35.4520.4% undervalued
2 followersusers have followed this narrative
0 commentsusers have commented on this narrative
0 likesusers have liked this narrative
Popular Narratives
TH

TheWallstreetKing on MicroVision ·
MicroVision will explode future revenue by 380.37% with a vision towards success
Fair Value:US$6098.4% undervalued
109 followersusers have followed this narrative
11 commentsusers have commented on this narrative
22 likesusers have liked this narrative
AN

AnalystConsensusTarget on NVIDIA ·
NVDA: Expanding AI Demand Will Drive Major Data Center Investments Through 2026
Fair Value:US$250.3928.1% undervalued
939 followersusers have followed this narrative
6 commentsusers have commented on this narrative
24 likesusers have liked this narrative
OS


oscargarcia on Alphabet ·
The company that turned a verb into a global necessity and basically runs the modern internet, digital ads, smartphones, maps, and AI.
Fair Value:US$3407.4% undervalued
145 followersusers have followed this narrative
6 commentsusers have commented on this narrative
18 likesusers have liked this narrative