- South Korea
- /
- Electronic Equipment and Components
- /
- KOSE:A011070
Is LG Innotek (KRX:011070) Using Too Much Debt?

Warren Buffett famously said, 'Volatility is far from synonymous with risk.' It's only natural to consider a company's balance sheet when you examine how risky it is, since debt is often involved when a business collapses. Importantly, LG Innotek Co., Ltd. (KRX:011070) does carry debt. But should shareholders be worried about its use of debt?
Why Does Debt Bring Risk?
Generally speaking, debt only becomes a real problem when a company can't easily pay it off, either by raising capital or with its own cash flow. If things get really bad, the lenders can take control of the business. While that is not too common, we often do see indebted companies permanently diluting shareholders because lenders force them to raise capital at a distressed price. Of course, plenty of companies use debt to fund growth, without any negative consequences. When we think about a company's use of debt, we first look at cash and debt together.
View our latest analysis for LG Innotek
What Is LG Innotek's Net Debt?
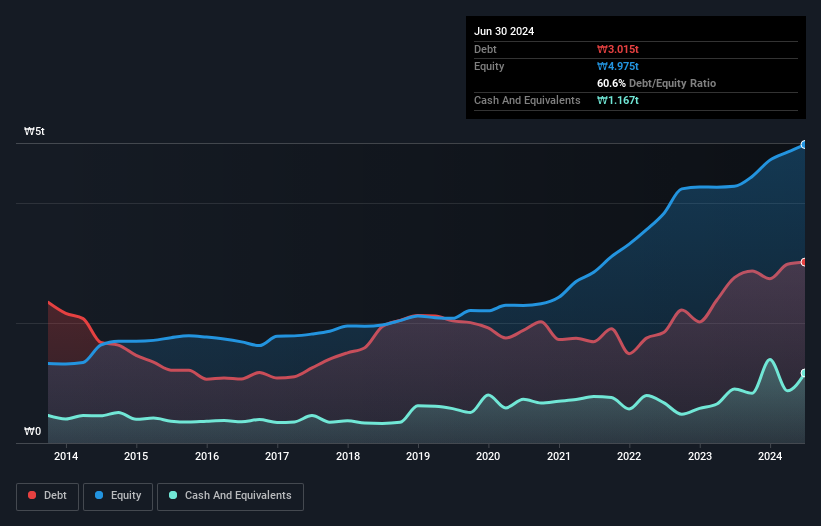
The image below, which you can click on for greater detail, shows that at June 2024 LG Innotek had debt of ₩3.01t, up from ₩2.76t in one year. However, it also had ₩1.17t in cash, and so its net debt is ₩1.85t.
How Strong Is LG Innotek's Balance Sheet?
According to the last reported balance sheet, LG Innotek had liabilities of ₩3.05t due within 12 months, and liabilities of ₩2.47t due beyond 12 months. Offsetting this, it had ₩1.17t in cash and ₩1.71t in receivables that were due within 12 months. So its liabilities total ₩2.64t more than the combination of its cash and short-term receivables.
While this might seem like a lot, it is not so bad since LG Innotek has a market capitalization of ₩6.01t, and so it could probably strengthen its balance sheet by raising capital if it needed to. However, it is still worthwhile taking a close look at its ability to pay off debt.
In order to size up a company's debt relative to its earnings, we calculate its net debt divided by its earnings before interest, tax, depreciation, and amortization (EBITDA) and its earnings before interest and tax (EBIT) divided by its interest expense (its interest cover). This way, we consider both the absolute quantum of the debt, as well as the interest rates paid on it.
LG Innotek has a low net debt to EBITDA ratio of only 0.83. And its EBIT easily covers its interest expense, being 13.4 times the size. So you could argue it is no more threatened by its debt than an elephant is by a mouse. Another good sign is that LG Innotek has been able to increase its EBIT by 28% in twelve months, making it easier to pay down debt. The balance sheet is clearly the area to focus on when you are analysing debt. But ultimately the future profitability of the business will decide if LG Innotek can strengthen its balance sheet over time. So if you want to see what the professionals think, you might find this free report on analyst profit forecasts to be interesting.
Finally, a company can only pay off debt with cold hard cash, not accounting profits. So we clearly need to look at whether that EBIT is leading to corresponding free cash flow. Considering the last three years, LG Innotek actually recorded a cash outflow, overall. Debt is usually more expensive, and almost always more risky in the hands of a company with negative free cash flow. Shareholders ought to hope for an improvement.
Our View
LG Innotek's interest cover was a real positive on this analysis, as was its EBIT growth rate. In contrast, our confidence was undermined by its apparent struggle to convert EBIT to free cash flow. When we consider all the elements mentioned above, it seems to us that LG Innotek is managing its debt quite well. But a word of caution: we think debt levels are high enough to justify ongoing monitoring. Over time, share prices tend to follow earnings per share, so if you're interested in LG Innotek, you may well want to click here to check an interactive graph of its earnings per share history.
If, after all that, you're more interested in a fast growing company with a rock-solid balance sheet, then check out our list of net cash growth stocks without delay.
The New Payments ETF Is Live on NASDAQ:
Money is moving to real-time rails, and a newly listed ETF now gives investors direct exposure. Fast settlement. Institutional custody. Simple access.
Explore how this launch could reshape portfolios
Sponsored ContentNew: AI Stock Screener & Alerts
Our new AI Stock Screener scans the market every day to uncover opportunities.
• Dividend Powerhouses (3%+ Yield)
• Undervalued Small Caps with Insider Buying
• High growth Tech and AI Companies
Or build your own from over 50 metrics.
Have feedback on this article? Concerned about the content? Get in touch with us directly. Alternatively, email editorial-team (at) simplywallst.com.
This article by Simply Wall St is general in nature. We provide commentary based on historical data and analyst forecasts only using an unbiased methodology and our articles are not intended to be financial advice. It does not constitute a recommendation to buy or sell any stock, and does not take account of your objectives, or your financial situation. We aim to bring you long-term focused analysis driven by fundamental data. Note that our analysis may not factor in the latest price-sensitive company announcements or qualitative material. Simply Wall St has no position in any stocks mentioned.
About KOSE:A011070
LG Innotek
Engages in the manufacture and sale of electronic materials and components for mobile, display, semiconductor, automobile, and Internet of Things (IoT) fields in South Korea and internationally.
Flawless balance sheet and slightly overvalued.
Similar Companies
Market Insights

Weekly Picks

Early mover in a fast growing industry. Likely to experience share price volatility as they scale


A case for CA$31.80 (undiluted), aka 8,616% upside from CA$0.37 (an 86 bagger!).


Moderation and Stabilisation: HOLD: Fair Price based on a 4-year Cycle is $12.08
Recently Updated Narratives

Airbnb Stock: Platform Growth in a World of Saturation and Scrutiny

Clarivate Stock: When Data Becomes the Backbone of Innovation and Law

Adobe Stock: AI-Fueled ARR Growth Pushes Guidance Higher, But Cost Pressures Loom
Popular Narratives


Crazy Undervalued 42 Baggers Silver Play (Active & Running Mine)


NVDA: Expanding AI Demand Will Drive Major Data Center Investments Through 2026


MicroVision will explode future revenue by 380.37% with a vision towards success
Trending Discussion
