- South Korea
- /
- Electronic Equipment and Components
- /
- KOSDAQ:A179900
Is UTI (KOSDAQ:179900) A Risky Investment?

David Iben put it well when he said, 'Volatility is not a risk we care about. What we care about is avoiding the permanent loss of capital.' When we think about how risky a company is, we always like to look at its use of debt, since debt overload can lead to ruin. Importantly, UTI Inc (KOSDAQ:179900) does carry debt. But should shareholders be worried about its use of debt?
What Risk Does Debt Bring?
Debt is a tool to help businesses grow, but if a business is incapable of paying off its lenders, then it exists at their mercy. If things get really bad, the lenders can take control of the business. However, a more common (but still painful) scenario is that it has to raise new equity capital at a low price, thus permanently diluting shareholders. Of course, the upside of debt is that it often represents cheap capital, especially when it replaces dilution in a company with the ability to reinvest at high rates of return. The first thing to do when considering how much debt a business uses is to look at its cash and debt together.
Check out our latest analysis for UTI
How Much Debt Does UTI Carry?
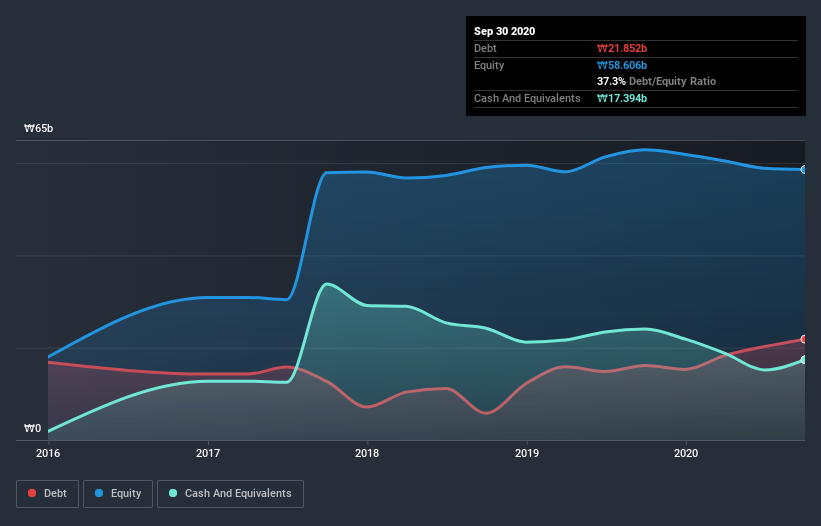
As you can see below, at the end of September 2020, UTI had ₩21.9b of debt, up from ₩16.1b a year ago. Click the image for more detail. However, it does have ₩17.4b in cash offsetting this, leading to net debt of about ₩4.46b.
A Look At UTI's Liabilities
The latest balance sheet data shows that UTI had liabilities of ₩27.8b due within a year, and liabilities of ₩2.55b falling due after that. Offsetting these obligations, it had cash of ₩17.4b as well as receivables valued at ₩10.8b due within 12 months. So it has liabilities totalling ₩2.18b more than its cash and near-term receivables, combined.
Having regard to UTI's size, it seems that its liquid assets are well balanced with its total liabilities. So it's very unlikely that the ₩294.4b company is short on cash, but still worth keeping an eye on the balance sheet. When analysing debt levels, the balance sheet is the obvious place to start. But you can't view debt in total isolation; since UTI will need earnings to service that debt. So when considering debt, it's definitely worth looking at the earnings trend. Click here for an interactive snapshot.
Over 12 months, UTI made a loss at the EBIT level, and saw its revenue drop to ₩59b, which is a fall of 12%. That's not what we would hope to see.
Caveat Emptor
Not only did UTI's revenue slip over the last twelve months, but it also produced negative earnings before interest and tax (EBIT). To be specific the EBIT loss came in at ₩1.1b. When we look at that and recall the liabilities on its balance sheet, relative to cash, it seems unwise to us for the company to have any debt. So we think its balance sheet is a little strained, though not beyond repair. However, it doesn't help that it burned through ₩10b of cash over the last year. So suffice it to say we do consider the stock to be risky. When analysing debt levels, the balance sheet is the obvious place to start. But ultimately, every company can contain risks that exist outside of the balance sheet. For example UTI has 2 warning signs (and 1 which shouldn't be ignored) we think you should know about.
If, after all that, you're more interested in a fast growing company with a rock-solid balance sheet, then check out our list of net cash growth stocks without delay.
When trading UTI or any other investment, use the platform considered by many to be the Professional's Gateway to the Worlds Market, Interactive Brokers. You get the lowest-cost* trading on stocks, options, futures, forex, bonds and funds worldwide from a single integrated account. Promoted
The New Payments ETF Is Live on NASDAQ:
Money is moving to real-time rails, and a newly listed ETF now gives investors direct exposure. Fast settlement. Institutional custody. Simple access.
Explore how this launch could reshape portfolios
Sponsored ContentNew: AI Stock Screener & Alerts
Our new AI Stock Screener scans the market every day to uncover opportunities.
• Dividend Powerhouses (3%+ Yield)
• Undervalued Small Caps with Insider Buying
• High growth Tech and AI Companies
Or build your own from over 50 metrics.
This article by Simply Wall St is general in nature. It does not constitute a recommendation to buy or sell any stock, and does not take account of your objectives, or your financial situation. We aim to bring you long-term focused analysis driven by fundamental data. Note that our analysis may not factor in the latest price-sensitive company announcements or qualitative material. Simply Wall St has no position in any stocks mentioned.
*Interactive Brokers Rated Lowest Cost Broker by StockBrokers.com Annual Online Review 2020
Have feedback on this article? Concerned about the content? Get in touch with us directly. Alternatively, email editorial-team (at) simplywallst.com.
About KOSDAQ:A179900
UTI
Engages in the research, development, manufacture, and sale of smartphone camera windows and sensor glasses in South Korea and internationally.
Exceptional growth potential with mediocre balance sheet.
Market Insights

Weekly Picks

Early mover in a fast growing industry. Likely to experience share price volatility as they scale


A case for CA$31.80 (undiluted), aka 8,616% upside from CA$0.37 (an 86 bagger!).


Moderation and Stabilisation: HOLD: Fair Price based on a 4-year Cycle is $12.08
Recently Updated Narratives

Airbnb Stock: Platform Growth in a World of Saturation and Scrutiny

Clarivate Stock: When Data Becomes the Backbone of Innovation and Law

Adobe Stock: AI-Fueled ARR Growth Pushes Guidance Higher, But Cost Pressures Loom
Popular Narratives


Crazy Undervalued 42 Baggers Silver Play (Active & Running Mine)


NVDA: Expanding AI Demand Will Drive Major Data Center Investments Through 2026


MicroVision will explode future revenue by 380.37% with a vision towards success
Trending Discussion
