
Advertisement
- South Korea
- /
- Electronic Equipment and Components
- /
- KOSDAQ:A094970
Do You Know What JMT Co.,Ltd.'s (KOSDAQ:094970) P/E Ratio Means?

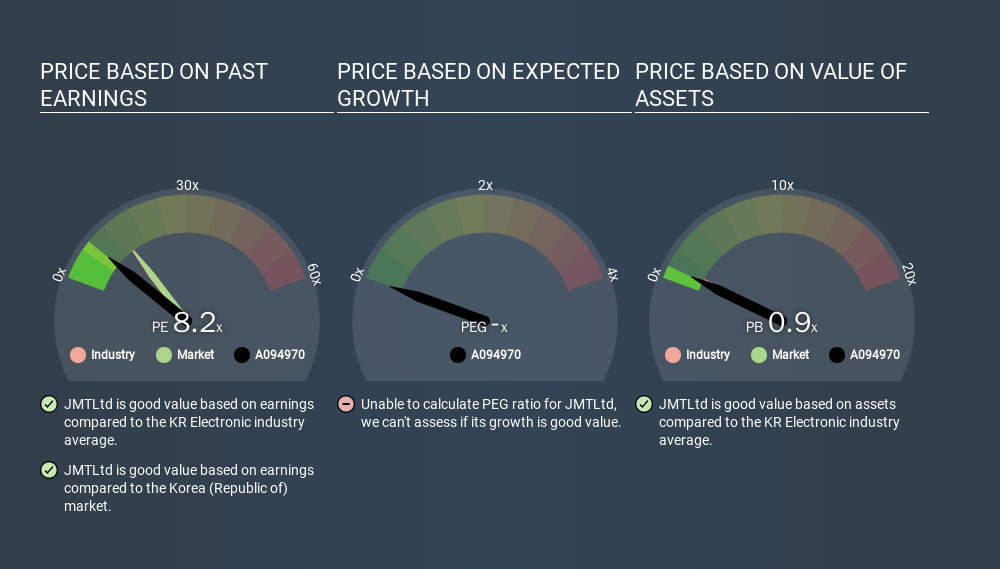
Today, we'll introduce the concept of the P/E ratio for those who are learning about investing. We'll show how you can use JMT Co.,Ltd.'s (KOSDAQ:094970) P/E ratio to inform your assessment of the investment opportunity. Based on the last twelve months, JMTLtd's P/E ratio is 8.16. That is equivalent to an earnings yield of about 12.3%.
See our latest analysis for JMTLtd
How Do I Calculate JMTLtd's Price To Earnings Ratio?
The formula for price to earnings is:
Price to Earnings Ratio = Share Price ÷ Earnings per Share (EPS)
Or for JMTLtd:
P/E of 8.16 = ₩2980.000 ÷ ₩365.148 (Based on the trailing twelve months to September 2019.)
(Note: the above calculation results may not be precise due to rounding.)
Is A High Price-to-Earnings Ratio Good?
A higher P/E ratio implies that investors pay a higher price for the earning power of the business. That isn't a good or a bad thing on its own, but a high P/E means that buyers have a higher opinion of the business's prospects, relative to stocks with a lower P/E.
Does JMTLtd Have A Relatively High Or Low P/E For Its Industry?
We can get an indication of market expectations by looking at the P/E ratio. We can see in the image below that the average P/E (13.8) for companies in the electronic industry is higher than JMTLtd's P/E.
JMTLtd's P/E tells us that market participants think it will not fare as well as its peers in the same industry. While current expectations are low, the stock could be undervalued if the situation is better than the market assumes. You should delve deeper. I like to check if company insiders have been buying or selling.
How Growth Rates Impact P/E Ratios
P/E ratios primarily reflect market expectations around earnings growth rates. Earnings growth means that in the future the 'E' will be higher. That means unless the share price increases, the P/E will reduce in a few years. And as that P/E ratio drops, the company will look cheap, unless its share price increases.
JMTLtd saw earnings per share decrease by 47% last year. But over the longer term (5 years) earnings per share have increased by 13%.
A Limitation: P/E Ratios Ignore Debt and Cash In The Bank
Don't forget that the P/E ratio considers market capitalization. So it won't reflect the advantage of cash, or disadvantage of debt. Theoretically, a business can improve its earnings (and produce a lower P/E in the future) by investing in growth. That means taking on debt (or spending its cash).
While growth expenditure doesn't always pay off, the point is that it is a good option to have; but one that the P/E ratio ignores.
So What Does JMTLtd's Balance Sheet Tell Us?
With net cash of ₩21b, JMTLtd has a very strong balance sheet, which may be important for its business. Having said that, at 42% of its market capitalization the cash hoard would contribute towards a higher P/E ratio.
The Verdict On JMTLtd's P/E Ratio
JMTLtd has a P/E of 8.2. That's below the average in the KR market, which is 14.1. The recent drop in earnings per share would make investors cautious, the relatively strong balance sheet will allow the company time to invest in growth. If it achieves that, then there's real potential that the low P/E could eventually indicate undervaluation.
Investors have an opportunity when market expectations about a stock are wrong. If it is underestimating a company, investors can make money by buying and holding the shares until the market corrects itself. Although we don't have analyst forecasts shareholders might want to examine this detailed historical graph of earnings, revenue and cash flow.
But note: JMTLtd may not be the best stock to buy. So take a peek at this free list of interesting companies with strong recent earnings growth (and a P/E ratio below 20).
If you spot an error that warrants correction, please contact the editor at editorial-team@simplywallst.com. This article by Simply Wall St is general in nature. It does not constitute a recommendation to buy or sell any stock, and does not take account of your objectives, or your financial situation. Simply Wall St has no position in the stocks mentioned.
We aim to bring you long-term focused research analysis driven by fundamental data. Note that our analysis may not factor in the latest price-sensitive company announcements or qualitative material. Thank you for reading.
About KOSDAQ:A094970
JMTLtd
Engages in the general electronic manufacturing services business in the information-communication field in South Korea and internationally.
Excellent balance sheet low.
Market Insights


Advertisement
Community Narratives
For the Emperor: Why Games Workshop Could Be a Star Investment
Fair Value UK£160.00|0.4% undervalued
RO
Community Contributor
Securitas will boost margins with AI and tech-driven services
Fair Value SEK 260.91|45.0% undervalued
UN
Community Contributor
A Leader in EV Charging with Growth Potential
Fair Value €27.00|20.4% undervalued
TI
Community Contributor