Warren Buffett famously said, 'Volatility is far from synonymous with risk.' So it might be obvious that you need to consider debt, when you think about how risky any given stock is, because too much debt can sink a company. We can see that KESPION Co., Ltd. (KOSDAQ:079190) does use debt in its business. But the more important question is: how much risk is that debt creating?
What Risk Does Debt Bring?
Debt assists a business until the business has trouble paying it off, either with new capital or with free cash flow. If things get really bad, the lenders can take control of the business. While that is not too common, we often do see indebted companies permanently diluting shareholders because lenders force them to raise capital at a distressed price. Of course, plenty of companies use debt to fund growth, without any negative consequences. The first step when considering a company's debt levels is to consider its cash and debt together.
See our latest analysis for KESPION
How Much Debt Does KESPION Carry?
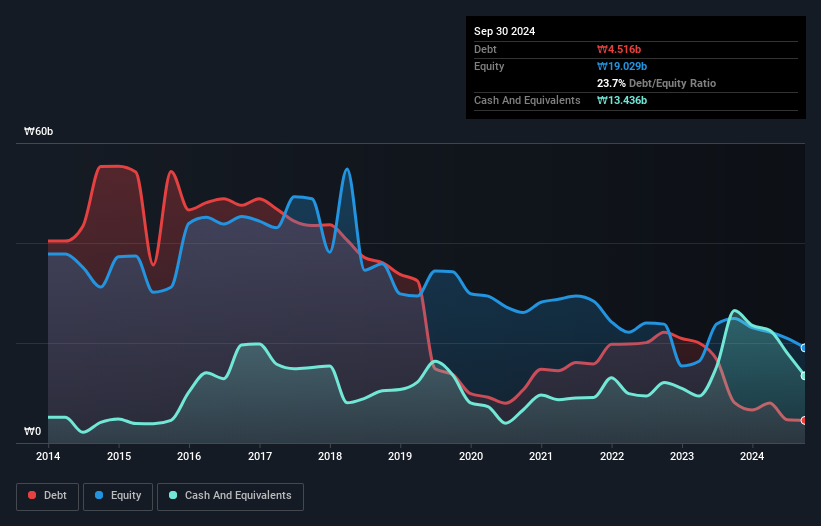
The image below, which you can click on for greater detail, shows that KESPION had debt of ₩4.52b at the end of September 2024, a reduction from ₩8.07b over a year. However, it does have ₩13.4b in cash offsetting this, leading to net cash of ₩8.92b.

How Strong Is KESPION's Balance Sheet?
We can see from the most recent balance sheet that KESPION had liabilities of ₩12.3b falling due within a year, and liabilities of ₩3.85b due beyond that. On the other hand, it had cash of ₩13.4b and ₩3.55b worth of receivables due within a year. So it can boast ₩858.9m more liquid assets than total liabilities.
This short term liquidity is a sign that KESPION could probably pay off its debt with ease, as its balance sheet is far from stretched. Succinctly put, KESPION boasts net cash, so it's fair to say it does not have a heavy debt load! There's no doubt that we learn most about debt from the balance sheet. But you can't view debt in total isolation; since KESPION will need earnings to service that debt. So if you're keen to discover more about its earnings, it might be worth checking out this graph of its long term earnings trend.
Over 12 months, KESPION made a loss at the EBIT level, and saw its revenue drop to ₩36b, which is a fall of 46%. To be frank that doesn't bode well.
So How Risky Is KESPION?
By their very nature companies that are losing money are more risky than those with a long history of profitability. And in the last year KESPION had an earnings before interest and tax (EBIT) loss, truth be told. Indeed, in that time it burnt through ₩6.0b of cash and made a loss of ₩5.7b. But at least it has ₩8.92b on the balance sheet to spend on growth, near-term. Even though its balance sheet seems sufficiently liquid, debt always makes us a little nervous if a company doesn't produce free cash flow regularly. The balance sheet is clearly the area to focus on when you are analysing debt. However, not all investment risk resides within the balance sheet - far from it. For example KESPION has 2 warning signs (and 1 which can't be ignored) we think you should know about.
Of course, if you're the type of investor who prefers buying stocks without the burden of debt, then don't hesitate to discover our exclusive list of net cash growth stocks, today.
Valuation is complex, but we're here to simplify it.
Discover if KESPION might be undervalued or overvalued with our detailed analysis, featuring fair value estimates, potential risks, dividends, insider trades, and its financial condition.
Access Free AnalysisHave feedback on this article? Concerned about the content? Get in touch with us directly. Alternatively, email editorial-team (at) simplywallst.com.
This article by Simply Wall St is general in nature. We provide commentary based on historical data and analyst forecasts only using an unbiased methodology and our articles are not intended to be financial advice. It does not constitute a recommendation to buy or sell any stock, and does not take account of your objectives, or your financial situation. We aim to bring you long-term focused analysis driven by fundamental data. Note that our analysis may not factor in the latest price-sensitive company announcements or qualitative material. Simply Wall St has no position in any stocks mentioned.
About KOSDAQ:A079190
KESPION
Produces and sells mobile antennas, material elements, smart grid solutions, and wireless security systems in South Korea.
Flawless balance sheet with very low risk.
Market Insights
Weekly Picks


Crazy Undervalued 42 Baggers Silver Play (Active & Running Mine)


Fiducian: Compliance Clouds or Value Opportunity?

Willamette Valley Vineyards (WVVI): Not-So-Great Value
Recently Updated Narratives

Watch Pulse Seismic Outperform with 13.6% Revenue Growth in the Coming Years

Significantly undervalued gold explorer in Timmins, finally getting traction

Moderation and Stabilisation: HOLD: Fair Price based on a 4-year Cycle is $12.08
Popular Narratives


MicroVision will explode future revenue by 380.37% with a vision towards success


NVDA: Expanding AI Demand Will Drive Major Data Center Investments Through 2026


