- South Korea
- /
- Electronic Equipment and Components
- /
- KOSDAQ:A069330
Is U.I.DisplayLtd (KOSDAQ:069330) Using Too Much Debt?

The external fund manager backed by Berkshire Hathaway's Charlie Munger, Li Lu, makes no bones about it when he says 'The biggest investment risk is not the volatility of prices, but whether you will suffer a permanent loss of capital.' When we think about how risky a company is, we always like to look at its use of debt, since debt overload can lead to ruin. Importantly, U.I.Display Co.,Ltd. (KOSDAQ:069330) does carry debt. But the real question is whether this debt is making the company risky.
Why Does Debt Bring Risk?
Debt is a tool to help businesses grow, but if a business is incapable of paying off its lenders, then it exists at their mercy. If things get really bad, the lenders can take control of the business. However, a more common (but still painful) scenario is that it has to raise new equity capital at a low price, thus permanently diluting shareholders. Of course, the upside of debt is that it often represents cheap capital, especially when it replaces dilution in a company with the ability to reinvest at high rates of return. The first thing to do when considering how much debt a business uses is to look at its cash and debt together.
Check out our latest analysis for U.I.DisplayLtd
What Is U.I.DisplayLtd's Debt?
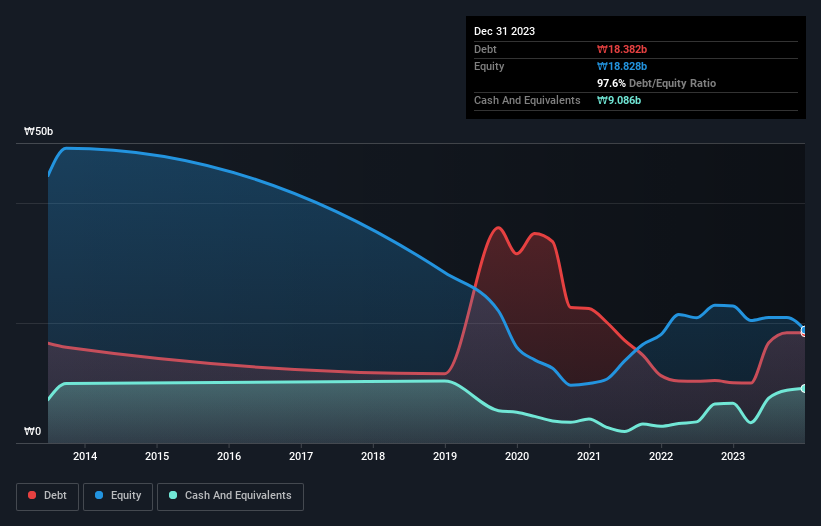
You can click the graphic below for the historical numbers, but it shows that as of December 2023 U.I.DisplayLtd had ₩18.4b of debt, an increase on ₩10.0b, over one year. However, it also had ₩9.09b in cash, and so its net debt is ₩9.30b.
How Strong Is U.I.DisplayLtd's Balance Sheet?
We can see from the most recent balance sheet that U.I.DisplayLtd had liabilities of ₩15.7b falling due within a year, and liabilities of ₩8.91b due beyond that. Offsetting these obligations, it had cash of ₩9.09b as well as receivables valued at ₩4.82b due within 12 months. So it has liabilities totalling ₩10.7b more than its cash and near-term receivables, combined.
This deficit isn't so bad because U.I.DisplayLtd is worth ₩19.9b, and thus could probably raise enough capital to shore up its balance sheet, if the need arose. However, it is still worthwhile taking a close look at its ability to pay off debt. There's no doubt that we learn most about debt from the balance sheet. But you can't view debt in total isolation; since U.I.DisplayLtd will need earnings to service that debt. So if you're keen to discover more about its earnings, it might be worth checking out this graph of its long term earnings trend.
In the last year U.I.DisplayLtd had a loss before interest and tax, and actually shrunk its revenue by 15%, to ₩53b. We would much prefer see growth.
Caveat Emptor
While U.I.DisplayLtd's falling revenue is about as heartwarming as a wet blanket, arguably its earnings before interest and tax (EBIT) loss is even less appealing. To be specific the EBIT loss came in at ₩325m. When we look at that and recall the liabilities on its balance sheet, relative to cash, it seems unwise to us for the company to have any debt. So we think its balance sheet is a little strained, though not beyond repair. Another cause for caution is that is bled ₩195m in negative free cash flow over the last twelve months. So to be blunt we think it is risky. The balance sheet is clearly the area to focus on when you are analysing debt. But ultimately, every company can contain risks that exist outside of the balance sheet. We've identified 1 warning sign with U.I.DisplayLtd , and understanding them should be part of your investment process.
If you're interested in investing in businesses that can grow profits without the burden of debt, then check out this free list of growing businesses that have net cash on the balance sheet.
The New Payments ETF Is Live on NASDAQ:
Money is moving to real-time rails, and a newly listed ETF now gives investors direct exposure. Fast settlement. Institutional custody. Simple access.
Explore how this launch could reshape portfolios
Sponsored ContentNew: AI Stock Screener & Alerts
Our new AI Stock Screener scans the market every day to uncover opportunities.
• Dividend Powerhouses (3%+ Yield)
• Undervalued Small Caps with Insider Buying
• High growth Tech and AI Companies
Or build your own from over 50 metrics.
Have feedback on this article? Concerned about the content? Get in touch with us directly. Alternatively, email editorial-team (at) simplywallst.com.
This article by Simply Wall St is general in nature. We provide commentary based on historical data and analyst forecasts only using an unbiased methodology and our articles are not intended to be financial advice. It does not constitute a recommendation to buy or sell any stock, and does not take account of your objectives, or your financial situation. We aim to bring you long-term focused analysis driven by fundamental data. Note that our analysis may not factor in the latest price-sensitive company announcements or qualitative material. Simply Wall St has no position in any stocks mentioned.
About KOSDAQ:A069330
U.I.DisplayLtd
Provides ITO coating, outdoor signage, and cover glass lamination products.
Acceptable track record with imperfect balance sheet.
Market Insights

Weekly Picks

Early mover in a fast growing industry. Likely to experience share price volatility as they scale


A case for CA$31.80 (undiluted), aka 8,616% upside from CA$0.37 (an 86 bagger!).


Moderation and Stabilisation: HOLD: Fair Price based on a 4-year Cycle is $12.08
Recently Updated Narratives


Title: Market Sentiment Is Dead Wrong — Here's Why PSEC Deserves a Second Look


An amazing opportunity to potentially get a 100 bagger

Amazon: Why the World’s Biggest Platform Still Runs on Invisible Economics
Popular Narratives


Crazy Undervalued 42 Baggers Silver Play (Active & Running Mine)


MicroVision will explode future revenue by 380.37% with a vision towards success


NVDA: Expanding AI Demand Will Drive Major Data Center Investments Through 2026
Trending Discussion
