- South Korea
- /
- Electronic Equipment and Components
- /
- KOSDAQ:A065690
Is PAKERS.Co.Ltd (KOSDAQ:065690) Using Too Much Debt?

Howard Marks put it nicely when he said that, rather than worrying about share price volatility, 'The possibility of permanent loss is the risk I worry about... and every practical investor I know worries about.' It's only natural to consider a company's balance sheet when you examine how risky it is, since debt is often involved when a business collapses. We can see that PAKERS.Co.,Ltd. (KOSDAQ:065690) does use debt in its business. But should shareholders be worried about its use of debt?
Why Does Debt Bring Risk?
Generally speaking, debt only becomes a real problem when a company can't easily pay it off, either by raising capital or with its own cash flow. If things get really bad, the lenders can take control of the business. However, a more usual (but still expensive) situation is where a company must dilute shareholders at a cheap share price simply to get debt under control. Of course, debt can be an important tool in businesses, particularly capital heavy businesses. The first thing to do when considering how much debt a business uses is to look at its cash and debt together.
See our latest analysis for PAKERS.Co.Ltd
What Is PAKERS.Co.Ltd's Net Debt?
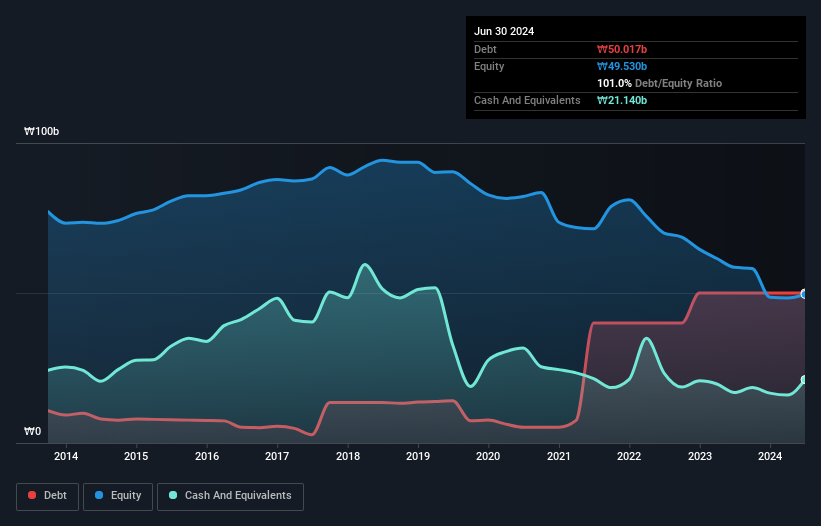
The chart below, which you can click on for greater detail, shows that PAKERS.Co.Ltd had ₩50.0b in debt in June 2024; about the same as the year before. On the flip side, it has ₩21.1b in cash leading to net debt of about ₩28.9b.
How Healthy Is PAKERS.Co.Ltd's Balance Sheet?
The latest balance sheet data shows that PAKERS.Co.Ltd had liabilities of ₩64.8b due within a year, and liabilities of ₩4.94b falling due after that. On the other hand, it had cash of ₩21.1b and ₩17.1b worth of receivables due within a year. So its liabilities total ₩31.6b more than the combination of its cash and short-term receivables.
The deficiency here weighs heavily on the ₩13.4b company itself, as if a child were struggling under the weight of an enormous back-pack full of books, his sports gear, and a trumpet. So we'd watch its balance sheet closely, without a doubt. At the end of the day, PAKERS.Co.Ltd would probably need a major re-capitalization if its creditors were to demand repayment. When analysing debt levels, the balance sheet is the obvious place to start. But you can't view debt in total isolation; since PAKERS.Co.Ltd will need earnings to service that debt. So when considering debt, it's definitely worth looking at the earnings trend. Click here for an interactive snapshot.
Over 12 months, PAKERS.Co.Ltd made a loss at the EBIT level, and saw its revenue drop to ₩62b, which is a fall of 11%. We would much prefer see growth.
Caveat Emptor
Not only did PAKERS.Co.Ltd's revenue slip over the last twelve months, but it also produced negative earnings before interest and tax (EBIT). Indeed, it lost a very considerable ₩4.5b at the EBIT level. Considering that alongside the liabilities mentioned above make us nervous about the company. It would need to improve its operations quickly for us to be interested in it. Not least because it had negative free cash flow of ₩844m over the last twelve months. That means it's on the risky side of things. The balance sheet is clearly the area to focus on when you are analysing debt. But ultimately, every company can contain risks that exist outside of the balance sheet. To that end, you should learn about the 2 warning signs we've spotted with PAKERS.Co.Ltd (including 1 which is potentially serious) .
At the end of the day, it's often better to focus on companies that are free from net debt. You can access our special list of such companies (all with a track record of profit growth). It's free.
The New Payments ETF Is Live on NASDAQ:
Money is moving to real-time rails, and a newly listed ETF now gives investors direct exposure. Fast settlement. Institutional custody. Simple access.
Explore how this launch could reshape portfolios
Sponsored ContentNew: Manage All Your Stock Portfolios in One Place
We've created the ultimate portfolio companion for stock investors, and it's free.
• Connect an unlimited number of Portfolios and see your total in one currency
• Be alerted to new Warning Signs or Risks via email or mobile
• Track the Fair Value of your stocks
Have feedback on this article? Concerned about the content? Get in touch with us directly. Alternatively, email editorial-team (at) simplywallst.com.
This article by Simply Wall St is general in nature. We provide commentary based on historical data and analyst forecasts only using an unbiased methodology and our articles are not intended to be financial advice. It does not constitute a recommendation to buy or sell any stock, and does not take account of your objectives, or your financial situation. We aim to bring you long-term focused analysis driven by fundamental data. Note that our analysis may not factor in the latest price-sensitive company announcements or qualitative material. Simply Wall St has no position in any stocks mentioned.
About KOSDAQ:A065690
PAKERS.Co.Ltd
Manufactures and sells electronic component in South Korea and internationally.
Good value with adequate balance sheet.
Market Insights

Weekly Picks

Early mover in a fast growing industry. Likely to experience share price volatility as they scale


A case for CA$31.80 (undiluted), aka 8,616% upside from CA$0.37 (an 86 bagger!).


Moderation and Stabilisation: HOLD: Fair Price based on a 4-year Cycle is $12.08
Recently Updated Narratives

Airbnb Stock: Platform Growth in a World of Saturation and Scrutiny

Adobe Stock: AI-Fueled ARR Growth Pushes Guidance Higher, But Cost Pressures Loom

Thomson Reuters Stock: When Legal Intelligence Becomes Mission-Critical Infrastructure
Popular Narratives


Crazy Undervalued 42 Baggers Silver Play (Active & Running Mine)


NVDA: Expanding AI Demand Will Drive Major Data Center Investments Through 2026

The AI Infrastructure Giant Grows Into Its Valuation
Trending Discussion


