
Advertisement
- South Korea
- /
- Electronic Equipment and Components
- /
- KOSDAQ:A065680
Is UJU Electronics Co. Ltd's (KOSDAQ:065680) Recent Stock Performance Influenced By Its Fundamentals In Any Way?
UJU Electronics' (KOSDAQ:065680) stock is up by a considerable 30% over the past three months. Given that stock prices are usually aligned with a company's financial performance in the long-term, we decided to study its financial indicators more closely to see if they had a hand to play in the recent price move. Particularly, we will be paying attention to UJU Electronics' ROE today.
Return on Equity or ROE is a test of how effectively a company is growing its value and managing investors’ money. In other words, it is a profitability ratio which measures the rate of return on the capital provided by the company's shareholders.
How Do You Calculate Return On Equity?
The formula for ROE is:
Return on Equity = Net Profit (from continuing operations) ÷ Shareholders' Equity
So, based on the above formula, the ROE for UJU Electronics is:
8.6% = ₩21b ÷ ₩249b (Based on the trailing twelve months to March 2025).
The 'return' is the profit over the last twelve months. One way to conceptualize this is that for each ₩1 of shareholders' capital it has, the company made ₩0.09 in profit.
View our latest analysis for UJU Electronics
What Is The Relationship Between ROE And Earnings Growth?
We have already established that ROE serves as an efficient profit-generating gauge for a company's future earnings. Depending on how much of these profits the company reinvests or "retains", and how effectively it does so, we are then able to assess a company’s earnings growth potential. Generally speaking, other things being equal, firms with a high return on equity and profit retention, have a higher growth rate than firms that don’t share these attributes.
UJU Electronics' Earnings Growth And 8.6% ROE
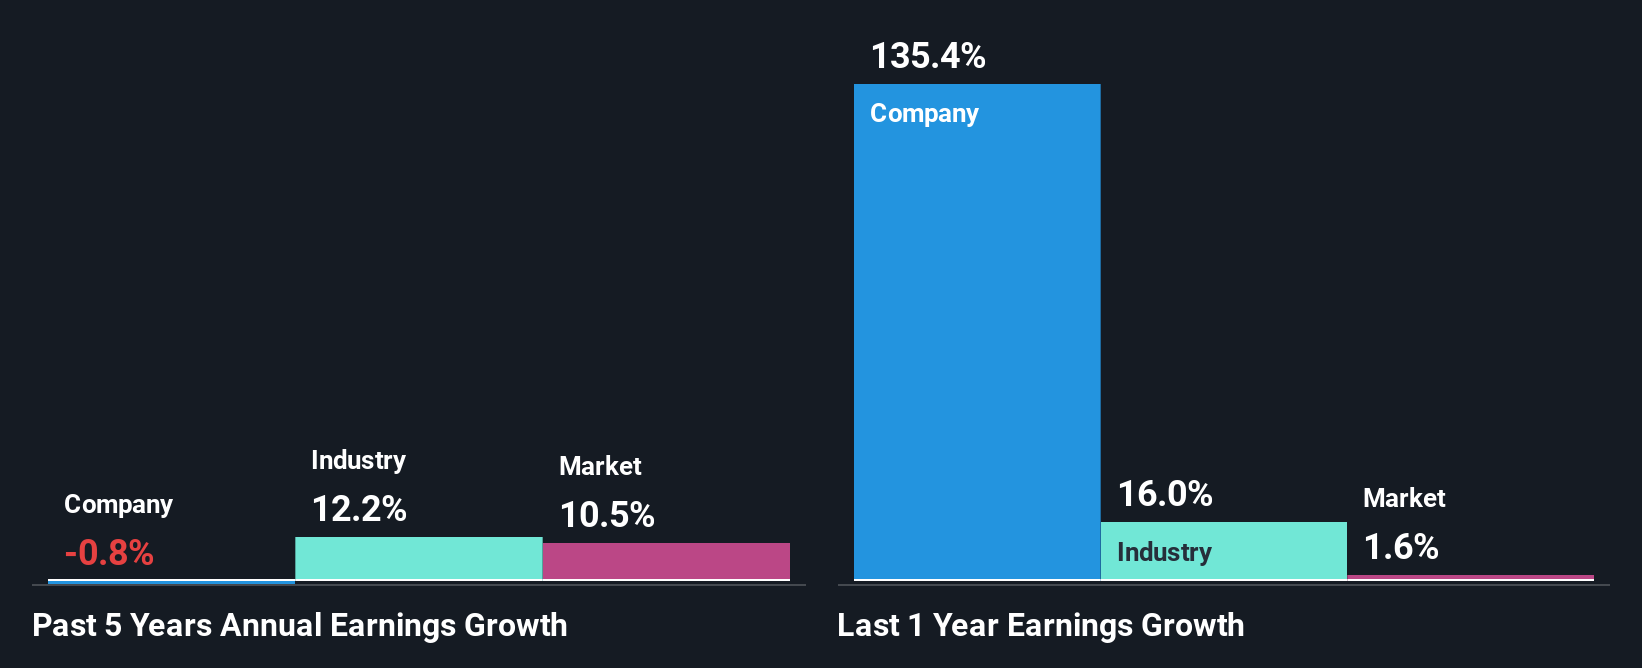
At first glance, UJU Electronics' ROE doesn't look very promising. However, the fact that the its ROE is quite higher to the industry average of 6.9% doesn't go unnoticed by us. Still, UJU Electronics has seen a flat net income growth over the past five years. Bear in mind, the company does have a slightly low ROE. It is just that the industry ROE is lower. Hence, this goes some way in explaining the flat earnings growth.
As a next step, we compared UJU Electronics' net income growth with the industry and discovered that the industry saw an average growth of 12% in the same period.
Earnings growth is an important metric to consider when valuing a stock. It’s important for an investor to know whether the market has priced in the company's expected earnings growth (or decline). Doing so will help them establish if the stock's future looks promising or ominous. Is UJU Electronics fairly valued compared to other companies? These 3 valuation measures might help you decide.
Is UJU Electronics Efficiently Re-investing Its Profits?
UJU Electronics' low three-year median payout ratio of 12%, (meaning the company retains88% of profits) should mean that the company is retaining most of its earnings and consequently, should see higher growth than it has reported.
Additionally, UJU Electronics has paid dividends over a period of six years, which means that the company's management is determined to pay dividends even if it means little to no earnings growth.
Conclusion
Overall, we feel that UJU Electronics certainly does have some positive factors to consider. However, while the company does have a decent ROE and a high profit retention, its earnings growth number is quite disappointing. This suggests that there might be some external threat to the business, that's hampering growth. Until now, we have only just grazed the surface of the company's past performance by looking at the company's fundamentals. To gain further insights into UJU Electronics' past profit growth, check out this visualization of past earnings, revenue and cash flows.
New: AI Stock Screener & Alerts
Our new AI Stock Screener scans the market every day to uncover opportunities.
• Dividend Powerhouses (3%+ Yield)
• Undervalued Small Caps with Insider Buying
• High growth Tech and AI Companies
Or build your own from over 50 metrics.
Have feedback on this article? Concerned about the content? Get in touch with us directly. Alternatively, email editorial-team (at) simplywallst.com.
This article by Simply Wall St is general in nature. We provide commentary based on historical data and analyst forecasts only using an unbiased methodology and our articles are not intended to be financial advice. It does not constitute a recommendation to buy or sell any stock, and does not take account of your objectives, or your financial situation. We aim to bring you long-term focused analysis driven by fundamental data. Note that our analysis may not factor in the latest price-sensitive company announcements or qualitative material. Simply Wall St has no position in any stocks mentioned.
About KOSDAQ:A065680
UJU Electronics
Manufactures and sells precision connectors and electronic components in South Korea and internationally.
Solid track record with excellent balance sheet.
Market Insights

Advertisement
Community Narratives
MINISO's fair value is projected at 26.69 with an anticipated PE ratio shift of 20x
Fair Value US$24.03|11.0% undervalued
BE
Community Contributor
Procter & Gamble: A Dividend Giant Facing Slowing Growth
Fair Value US$119.81|23.3% overvalued
AN
Community Contributor
Eli Lilly's Future Growth Driven by Tirzepatide and Favorable Market Conditions
Fair Value US$1.19k|13.8% undervalued
EA
Community Contributor