- South Korea
- /
- Electronic Equipment and Components
- /
- KOSDAQ:A051370
Interflex (KOSDAQ:051370 shareholders incur further losses as stock declines 10% this week, taking three-year losses to 49%

Many investors define successful investing as beating the market average over the long term. But the risk of stock picking is that you will likely buy under-performing companies. We regret to report that long term Interflex Co., Ltd. (KOSDAQ:051370) shareholders have had that experience, with the share price dropping 49% in three years, versus a market decline of about 4.4%. The more recent news is of little comfort, with the share price down 43% in a year. Even worse, it's down 13% in about a month, which isn't fun at all. Importantly, this could be a market reaction to the recently released financial results. You can check out the latest numbers in our company report.
Since Interflex has shed ₩22b from its value in the past 7 days, let's see if the longer term decline has been driven by the business' economics.
In his essay The Superinvestors of Graham-and-Doddsville Warren Buffett described how share prices do not always rationally reflect the value of a business. One imperfect but simple way to consider how the market perception of a company has shifted is to compare the change in the earnings per share (EPS) with the share price movement.
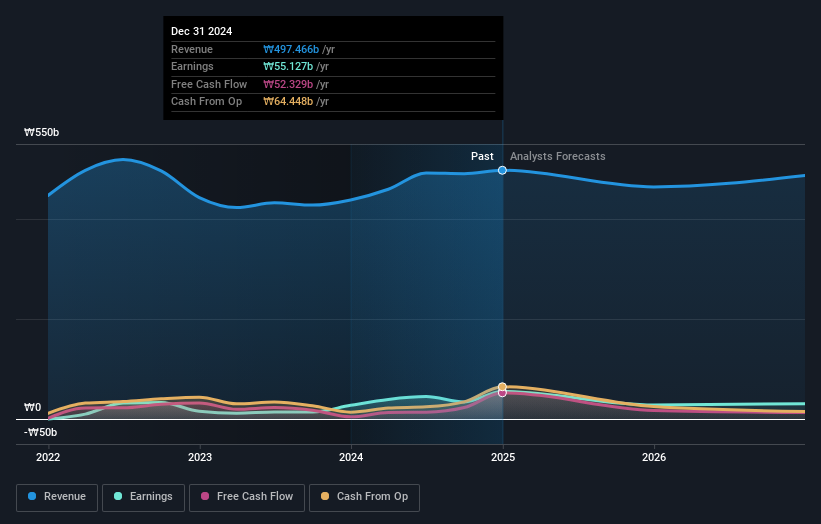
During five years of share price growth, Interflex moved from a loss to profitability. We would usually expect to see the share price rise as a result. So given the share price is down it's worth checking some other metrics too.
With revenue flat over three years, it seems unlikely that the share price is reflecting the top line. We're not entirely sure why the share price is dropped, but it does seem likely investors have become less optimistic about the business.
The graphic below depicts how earnings and revenue have changed over time (unveil the exact values by clicking on the image).

We know that Interflex has improved its bottom line over the last three years, but what does the future have in store? If you are thinking of buying or selling Interflex stock, you should check out this FREE detailed report on its balance sheet.
A Different Perspective
We regret to report that Interflex shareholders are down 43% for the year. Unfortunately, that's worse than the broader market decline of 8.2%. Having said that, it's inevitable that some stocks will be oversold in a falling market. The key is to keep your eyes on the fundamental developments. Unfortunately, last year's performance may indicate unresolved challenges, given that it was worse than the annualised loss of 3% over the last half decade. Generally speaking long term share price weakness can be a bad sign, though contrarian investors might want to research the stock in hope of a turnaround. While it is well worth considering the different impacts that market conditions can have on the share price, there are other factors that are even more important. Consider risks, for instance. Every company has them, and we've spotted 1 warning sign for Interflex you should know about.
Of course Interflex may not be the best stock to buy. So you may wish to see this free collection of growth stocks.
Please note, the market returns quoted in this article reflect the market weighted average returns of stocks that currently trade on South Korean exchanges.
New: AI Stock Screener & Alerts
Our new AI Stock Screener scans the market every day to uncover opportunities.
• Dividend Powerhouses (3%+ Yield)
• Undervalued Small Caps with Insider Buying
• High growth Tech and AI Companies
Or build your own from over 50 metrics.
Have feedback on this article? Concerned about the content? Get in touch with us directly. Alternatively, email editorial-team (at) simplywallst.com.
This article by Simply Wall St is general in nature. We provide commentary based on historical data and analyst forecasts only using an unbiased methodology and our articles are not intended to be financial advice. It does not constitute a recommendation to buy or sell any stock, and does not take account of your objectives, or your financial situation. We aim to bring you long-term focused analysis driven by fundamental data. Note that our analysis may not factor in the latest price-sensitive company announcements or qualitative material. Simply Wall St has no position in any stocks mentioned.
About KOSDAQ:A051370
Interflex
Manufactures and sells flexible printed circuit boards in South Korea.
Flawless balance sheet and undervalued.
Similar Companies
Market Insights
Community Narratives


