Advertisement
- South Korea
- /
- IT
- /
- KOSE:A031820
We Like These Underlying Return On Capital Trends At Comtec SystemsLtd (KRX:031820)
If you're looking for a multi-bagger, there's a few things to keep an eye out for. In a perfect world, we'd like to see a company investing more capital into its business and ideally the returns earned from that capital are also increasing. Ultimately, this demonstrates that it's a business that is reinvesting profits at increasing rates of return. With that in mind, we've noticed some promising trends at Comtec SystemsLtd (KRX:031820) so let's look a bit deeper.
Return On Capital Employed (ROCE): What Is It?
Just to clarify if you're unsure, ROCE is a metric for evaluating how much pre-tax income (in percentage terms) a company earns on the capital invested in its business. To calculate this metric for Comtec SystemsLtd, this is the formula:
Return on Capital Employed = Earnings Before Interest and Tax (EBIT) ÷ (Total Assets - Current Liabilities)
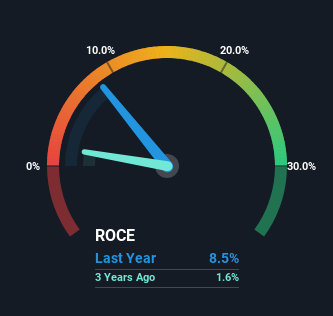
0.085 = ₩18b ÷ (₩445b - ₩228b) (Based on the trailing twelve months to March 2024).
So, Comtec SystemsLtd has an ROCE of 8.5%. In absolute terms, that's a low return but it's around the IT industry average of 8.3%.
View our latest analysis for Comtec SystemsLtd
While the past is not representative of the future, it can be helpful to know how a company has performed historically, which is why we have this chart above. If you're interested in investigating Comtec SystemsLtd's past further, check out this free graph covering Comtec SystemsLtd's past earnings, revenue and cash flow.
What Does the ROCE Trend For Comtec SystemsLtd Tell Us?
We're glad to see that ROCE is heading in the right direction, even if it is still low at the moment. The data shows that returns on capital have increased substantially over the last five years to 8.5%. The company is effectively making more money per dollar of capital used, and it's worth noting that the amount of capital has increased too, by 157%. This can indicate that there's plenty of opportunities to invest capital internally and at ever higher rates, a combination that's common among multi-baggers.
For the record though, there was a noticeable increase in the company's current liabilities over the period, so we would attribute some of the ROCE growth to that. The current liabilities has increased to 51% of total assets, so the business is now more funded by the likes of its suppliers or short-term creditors. And with current liabilities at those levels, that's pretty high.
The Bottom Line
To sum it up, Comtec SystemsLtd has proven it can reinvest in the business and generate higher returns on that capital employed, which is terrific. And since the stock has fallen 56% over the last five years, there might be an opportunity here. So researching this company further and determining whether or not these trends will continue seems justified.
On a separate note, we've found 3 warning signs for Comtec SystemsLtd you'll probably want to know about.
While Comtec SystemsLtd may not currently earn the highest returns, we've compiled a list of companies that currently earn more than 25% return on equity. Check out this free list here.
New: AI Stock Screener & Alerts
Our new AI Stock Screener scans the market every day to uncover opportunities.
• Dividend Powerhouses (3%+ Yield)
• Undervalued Small Caps with Insider Buying
• High growth Tech and AI Companies
Or build your own from over 50 metrics.
Have feedback on this article? Concerned about the content? Get in touch with us directly. Alternatively, email editorial-team (at) simplywallst.com.
This article by Simply Wall St is general in nature. We provide commentary based on historical data and analyst forecasts only using an unbiased methodology and our articles are not intended to be financial advice. It does not constitute a recommendation to buy or sell any stock, and does not take account of your objectives, or your financial situation. We aim to bring you long-term focused analysis driven by fundamental data. Note that our analysis may not factor in the latest price-sensitive company announcements or qualitative material. Simply Wall St has no position in any stocks mentioned.
Have feedback on this article? Concerned about the content? Get in touch with us directly. Alternatively, email editorial-team@simplywallst.com
About KOSE:A031820
ItcenctsLtd
Engages in the sale, installation, and maintenance of data communication equipment in Korea and internationally.
Solid track record with excellent balance sheet.
Market Insights


Advertisement
Weekly Picks
LO


Lou_Basenese on Cue Biopharma ·
Cue Biopharma (NASDAQ: CUE): The Scientist Behind Xolair Just Gave Cue a Next-Generation Shot at the Same Multi-Billion-Dollar Market
Fair Value:US$7057.9% undervalued
20 followersusers have followed this narrative
0 commentsusers have commented on this narrative
5 likesusers have liked this narrative
HE


HedgeY on AST SpaceMobile ·
AST SpaceMobile: The Boldest Direct-to-Cell Bet in Public Markets
Fair Value:US$17044.9% undervalued
41 followersusers have followed this narrative
0 commentsusers have commented on this narrative
12 likesusers have liked this narrative
FU

FundamentalFlow on Onto Innovation ·
Onto Innovation: The Advanced Packaging Chokepoint 51.3% undervalued intrinsic discount
Fair Value:US$38033.4% undervalued
26 followersusers have followed this narrative
0 commentsusers have commented on this narrative
7 likesusers have liked this narrative
MA


martinarauz on Nu Holdings ·
Investment Analysis (May 2026)
Fair Value:US$22.7447.4% undervalued
58 followersusers have followed this narrative
0 commentsusers have commented on this narrative
15 likesusers have liked this narrative
Recently Updated Narratives
TI

TimLee on 3REN Berhad ·
3REN Berhad Is Powering the Semiconductor Ecosystem and Smart Manufacturing
Fair Value:RM 0.6841.9% undervalued
1 followerusers have followed this narrative
0 commentsusers have commented on this narrative
0 likesusers have liked this narrative
AN

Anthony_Lee on Cheeding Holdings Berhad ·
Cheeding: The Hidden Beneficiary of Malaysia’s Power Grid Expansion
Fair Value:RM 1.242.9% undervalued
1 followerusers have followed this narrative
0 commentsusers have commented on this narrative
0 likesusers have liked this narrative
FU

FundamentalFlow on Karman Holdings ·
KRMN — Karman Space & Defense: Down 58% from Peak, Is the Market Mispricing a Hypergrowth Defense Compounder?
Fair Value:US$105.653.2% undervalued
3 followersusers have followed this narrative
0 commentsusers have commented on this narrative
0 likesusers have liked this narrative
Popular Narratives
MA
martinarauz on Nu Holdings ·
Investment Analysis (May 2026)
Fair Value:US$22.7447.4% undervalued
58 followersusers have followed this narrative
0 commentsusers have commented on this narrative
15 likesusers have liked this narrative
CL


Clive_Thompson on Take-Two Interactive Software ·
Take-Two Interactive: The Calm Before the Storm NASDAQ: TTWO Last Price: $242.41 Date: May 15, 2026
Fair Value:US$276.9722.6% undervalued
57 followersusers have followed this narrative
0 commentsusers have commented on this narrative
14 likesusers have liked this narrative
NI


niteco on Honeywell International ·
Honeywell - The Demand-Side of the AI Infrastructure
Fair Value:US$320.1933.2% undervalued
48 followersusers have followed this narrative
0 commentsusers have commented on this narrative
19 likesusers have liked this narrative
Trending Discussion
SI

Simply Wall St User on Access Holdings ·
It's wonderful. It has greatly helped me take informed decisions.
0
|0
CO


composite32 on Ronesans Gayrimenkul Yatirim ·
Selamlar Teşekkürler.. Radarımda olan bir şirket değil, Halka açıklık oranı %40'ın üzerinde olan şir...
0
|0
