
Advertisement
- South Korea
- /
- Semiconductors
- /
- KOSE:A003160
Slammed 28% D.I Corporation (KRX:003160) Screens Well Here But There Might Be A Catch
The D.I Corporation (KRX:003160) share price has softened a substantial 28% over the previous 30 days, handing back much of the gains the stock has made lately. Still, a bad month hasn't completely ruined the past year with the stock gaining 52%, which is great even in a bull market.
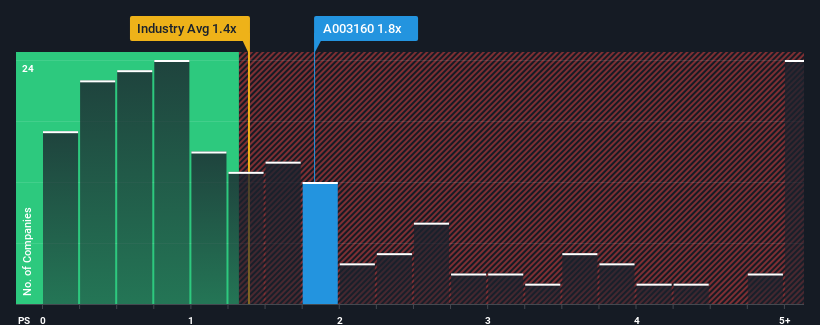
In spite of the heavy fall in price, it's still not a stretch to say that D.I's price-to-sales (or "P/S") ratio of 1.8x right now seems quite "middle-of-the-road" compared to the Semiconductor industry in Korea, where the median P/S ratio is around 1.4x. While this might not raise any eyebrows, if the P/S ratio is not justified investors could be missing out on a potential opportunity or ignoring looming disappointment.
See our latest analysis for D.I
What Does D.I's P/S Mean For Shareholders?
D.I hasn't been tracking well recently as its declining revenue compares poorly to other companies, which have seen some growth in their revenues on average. It might be that many expect the dour revenue performance to strengthen positively, which has kept the P/S from falling. If not, then existing shareholders may be a little nervous about the viability of the share price.
Keen to find out how analysts think D.I's future stacks up against the industry? In that case, our free report is a great place to start.Is There Some Revenue Growth Forecasted For D.I?
In order to justify its P/S ratio, D.I would need to produce growth that's similar to the industry.
Retrospectively, the last year delivered a frustrating 11% decrease to the company's top line. As a result, revenue from three years ago have also fallen 14% overall. So unfortunately, we have to acknowledge that the company has not done a great job of growing revenue over that time.
Shifting to the future, estimates from the two analysts covering the company suggest revenue should grow by 103% over the next year. That's shaping up to be materially higher than the 40% growth forecast for the broader industry.
With this information, we find it interesting that D.I is trading at a fairly similar P/S compared to the industry. It may be that most investors aren't convinced the company can achieve future growth expectations.
What Does D.I's P/S Mean For Investors?
With its share price dropping off a cliff, the P/S for D.I looks to be in line with the rest of the Semiconductor industry. Using the price-to-sales ratio alone to determine if you should sell your stock isn't sensible, however it can be a practical guide to the company's future prospects.
Despite enticing revenue growth figures that outpace the industry, D.I's P/S isn't quite what we'd expect. Perhaps uncertainty in the revenue forecasts are what's keeping the P/S ratio consistent with the rest of the industry. This uncertainty seems to be reflected in the share price which, while stable, could be higher given the revenue forecasts.
Plus, you should also learn about this 1 warning sign we've spotted with D.I.
Of course, profitable companies with a history of great earnings growth are generally safer bets. So you may wish to see this free collection of other companies that have reasonable P/E ratios and have grown earnings strongly.
New: Manage All Your Stock Portfolios in One Place
We've created the ultimate portfolio companion for stock investors, and it's free.
• Connect an unlimited number of Portfolios and see your total in one currency
• Be alerted to new Warning Signs or Risks via email or mobile
• Track the Fair Value of your stocks
Have feedback on this article? Concerned about the content? Get in touch with us directly. Alternatively, email editorial-team (at) simplywallst.com.
This article by Simply Wall St is general in nature. We provide commentary based on historical data and analyst forecasts only using an unbiased methodology and our articles are not intended to be financial advice. It does not constitute a recommendation to buy or sell any stock, and does not take account of your objectives, or your financial situation. We aim to bring you long-term focused analysis driven by fundamental data. Note that our analysis may not factor in the latest price-sensitive company announcements or qualitative material. Simply Wall St has no position in any stocks mentioned.
About KOSE:A003160
D.I
Manufactures and supplies semiconductor inspection equipment in South Korea and internationally.
High growth potential with adequate balance sheet.
Market Insights

Advertisement
Community Narratives
The Next Phase of Energy Storage: How NeoVolta Is Tackling America’s Power Crunch
Fair Value US$7.50|35.1% undervalued
MA
Community Contributor
Why EnSilica is Worth Possibly 13x its Current Price
Fair Value UK£5.00|89.8% undervalued
DO
Community Contributor
M&A Activity, Industry Diversification & A Defense Contract Monopoly Will Push BWXT For Healthy Long-Term Growth
Fair Value US$220.00|15.2% undervalued
CL
Community Contributor
A case for Cassiar Gold Corp (TSXV: GLDC) to reach CAD$8-10 before 2030 (X30-37)
Fair Value CA$10.00|96.0% undervalued
AG
Community Contributor