
Advertisement
- South Korea
- /
- Semiconductors
- /
- KOSDAQ:A241790
Oceanbridge's (KOSDAQ:241790) Sluggish Earnings Might Be Just The Beginning Of Its Problems
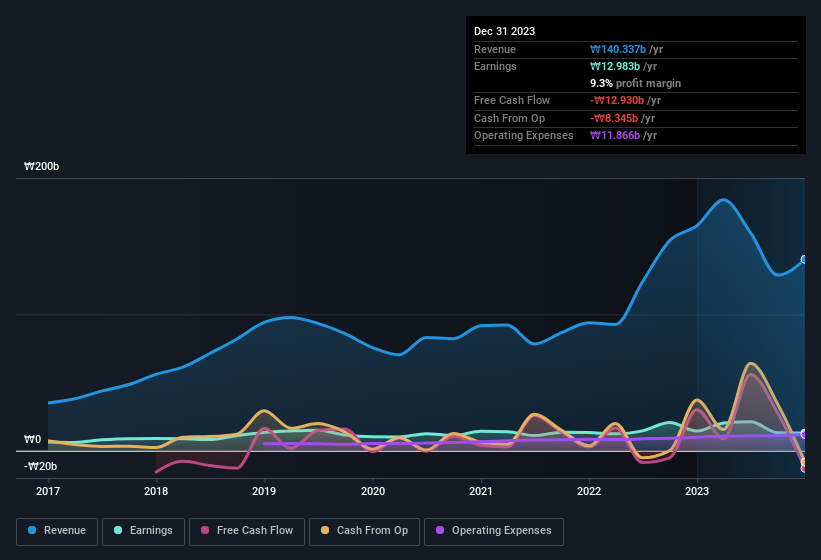
The subdued market reaction suggests that Oceanbridge Co., Ltd's (KOSDAQ:241790) recent earnings didn't contain any surprises. Our analysis suggests that along with soft profit numbers, investors should be aware of some other underlying weaknesses in the numbers.
See our latest analysis for Oceanbridge
Zooming In On Oceanbridge's Earnings
One key financial ratio used to measure how well a company converts its profit to free cash flow (FCF) is the accrual ratio. In plain english, this ratio subtracts FCF from net profit, and divides that number by the company's average operating assets over that period. The ratio shows us how much a company's profit exceeds its FCF.
As a result, a negative accrual ratio is a positive for the company, and a positive accrual ratio is a negative. That is not intended to imply we should worry about a positive accrual ratio, but it's worth noting where the accrual ratio is rather high. That's because some academic studies have suggested that high accruals ratios tend to lead to lower profit or less profit growth.
For the year to December 2023, Oceanbridge had an accrual ratio of 0.28. We can therefore deduce that its free cash flow fell well short of covering its statutory profit. Over the last year it actually had negative free cash flow of ₩13b, in contrast to the aforementioned profit of ₩13.0b. It's worth noting that Oceanbridge generated positive FCF of ₩30b a year ago, so at least they've done it in the past. However, that's not all there is to consider. We can see that unusual items have impacted its statutory profit, and therefore the accrual ratio. One positive for Oceanbridge shareholders is that it's accrual ratio was significantly better last year, providing reason to believe that it may return to stronger cash conversion in the future. As a result, some shareholders may be looking for stronger cash conversion in the current year.
Note: we always recommend investors check balance sheet strength. Click here to be taken to our balance sheet analysis of Oceanbridge.
The Impact Of Unusual Items On Profit
Given the accrual ratio, it's not overly surprising that Oceanbridge's profit was boosted by unusual items worth ₩1.8b in the last twelve months. We can't deny that higher profits generally leave us optimistic, but we'd prefer it if the profit were to be sustainable. When we analysed the vast majority of listed companies worldwide, we found that significant unusual items are often not repeated. Which is hardly surprising, given the name. Assuming those unusual items don't show up again in the current year, we'd thus expect profit to be weaker next year (in the absence of business growth, that is).
Our Take On Oceanbridge's Profit Performance
Summing up, Oceanbridge received a nice boost to profit from unusual items, but could not match its paper profit with free cash flow. For the reasons mentioned above, we think that a perfunctory glance at Oceanbridge's statutory profits might make it look better than it really is on an underlying level. So if you'd like to dive deeper into this stock, it's crucial to consider any risks it's facing. Case in point: We've spotted 3 warning signs for Oceanbridge you should be mindful of and 1 of these bad boys is concerning.
In this article we've looked at a number of factors that can impair the utility of profit numbers, and we've come away cautious. But there is always more to discover if you are capable of focussing your mind on minutiae. Some people consider a high return on equity to be a good sign of a quality business. While it might take a little research on your behalf, you may find this free collection of companies boasting high return on equity, or this list of stocks that insiders are buying to be useful.
Valuation is complex, but we're here to simplify it.
Discover if TEMC CNS might be undervalued or overvalued with our detailed analysis, featuring fair value estimates, potential risks, dividends, insider trades, and its financial condition.
Access Free AnalysisHave feedback on this article? Concerned about the content? Get in touch with us directly. Alternatively, email editorial-team (at) simplywallst.com.
This article by Simply Wall St is general in nature. We provide commentary based on historical data and analyst forecasts only using an unbiased methodology and our articles are not intended to be financial advice. It does not constitute a recommendation to buy or sell any stock, and does not take account of your objectives, or your financial situation. We aim to bring you long-term focused analysis driven by fundamental data. Note that our analysis may not factor in the latest price-sensitive company announcements or qualitative material. Simply Wall St has no position in any stocks mentioned.
About KOSDAQ:A241790
Excellent balance sheet with proven track record.
Market Insights

Advertisement
Community Narratives
MicroVision will explode future revenue by 380.37% with a vision towards success
Fair Value US$60|98.4% undervalued
TH
Community Contributor
The Indispensable Artery for a New North American Economy
Fair Value CA$132.87|0.7% overvalued
TI
Community Contributor
Recently Updated Narratives
CE

cementafriend on Constellation Energy ·
Constellation Energy Dividends and Growth
Fair Value:US$348.054.7% overvalued
2 followersusers have followed this narrative
0 commentsusers have commented on this narrative
0 likesusers have liked this narrative
KH

Khagani on CoreWeave ·
CoreWeave's Revenue Expected to Rocket 77.88% in 5-Year Forecast
Fair Value:US$11033.5% undervalued
4 followersusers have followed this narrative
0 commentsusers have commented on this narrative
0 likesusers have liked this narrative
PO

PortfolioPlus on Bisalloy Steel Group ·
Bisalloy Steel Group will shine with a projected profit margin increase of 12.8%
Fair Value:AU$6.7118.0% undervalued
3 followersusers have followed this narrative
0 commentsusers have commented on this narrative
0 likesusers have liked this narrative
Popular Narratives
TH

TheWallstreetKing on MicroVision ·
MicroVision will explode future revenue by 380.37% with a vision towards success
Fair Value:US$6098.4% undervalued
108 followersusers have followed this narrative
10 commentsusers have commented on this narrative
21 likesusers have liked this narrative
AN


AnalystConsensusTarget on NVIDIA ·
NVDA: Expanding AI Demand Will Drive Major Data Center Investments Through 2026
Fair Value:US$250.3929.3% undervalued
936 followersusers have followed this narrative
6 commentsusers have commented on this narrative
24 likesusers have liked this narrative
OS


oscargarcia on Alphabet ·
The company that turned a verb into a global necessity and basically runs the modern internet, digital ads, smartphones, maps, and AI.
Fair Value:US$3405.8% undervalued
144 followersusers have followed this narrative
6 commentsusers have commented on this narrative
18 likesusers have liked this narrative