3 Growth Companies With High Insider Ownership And 10% Revenue Growth

Reviewed by Simply Wall St

As global markets navigate a period of mixed performance, with major stock indexes showing varied results and expectations for interest rate adjustments by central banks, investors are keenly observing the trends in growth stocks. In such an environment, companies that not only demonstrate robust revenue growth but also have high insider ownership can be particularly appealing, as they suggest confidence from those who know the business best.
Top 10 Growth Companies With High Insider Ownership
| Name | Insider Ownership | Earnings Growth |
| SKS Technologies Group (ASX:SKS) | 27% | 24.8% |
| Propel Holdings (TSX:PRL) | 36.9% | 37.6% |
| On Holding (NYSE:ONON) | 19.1% | 29.4% |
| Medley (TSE:4480) | 34% | 31.7% |
| Pharma Mar (BME:PHM) | 11.8% | 56.2% |
| CD Projekt (WSE:CDR) | 29.7% | 27% |
| EHang Holdings (NasdaqGM:EH) | 32.8% | 81.5% |
| Credo Technology Group Holding (NasdaqGS:CRDO) | 13.4% | 65.9% |
| Elliptic Laboratories (OB:ELABS) | 26.8% | 111.4% |
| Findi (ASX:FND) | 34.8% | 112.9% |
Let's uncover some gems from our specialized screener.
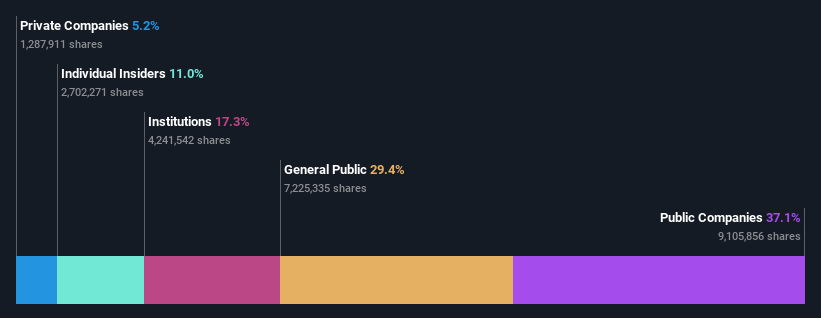
Duk San NeoluxLtd (KOSDAQ:A213420)
Simply Wall St Growth Rating: ★★★★☆☆
Overview: Duk San Neolux Co., Ltd specializes in developing and manufacturing OLED materials for the display industry in South Korea, with a market cap of approximately ₩671.80 billion.
Operations: The company's revenue is primarily derived from its semiconductors segment, totaling approximately ₩205.55 million.
Insider Ownership: 11.1%
Revenue Growth Forecast: 18.2% p.a.
Duk San Neolux Ltd. is forecast to experience robust earnings growth at 22.4% annually, outpacing the broader Korean market's 12.3%. Despite trading at a significant discount of 39.1% below its estimated fair value, it exhibits strong revenue growth projections of 18.2% per year, surpassing the market average of 5.3%. Insider ownership remains stable with no substantial buying or selling activity in recent months, reflecting confidence in its strategic direction and potential for future growth.
- Click here and access our complete growth analysis report to understand the dynamics of Duk San NeoluxLtd.
- Upon reviewing our latest valuation report, Duk San NeoluxLtd's share price might be too optimistic.
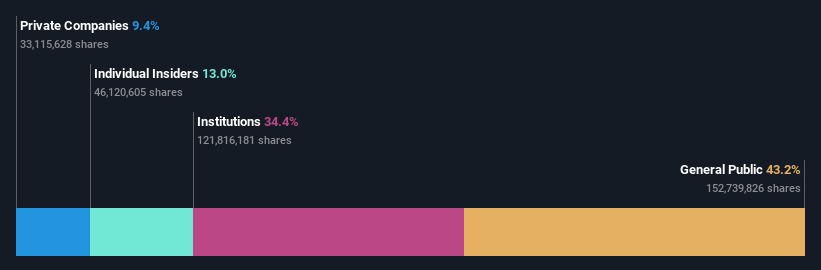
Hiwin Technologies (TWSE:2049)
Simply Wall St Growth Rating: ★★★★☆☆
Overview: Hiwin Technologies Corporation manufactures and sells motion control and systematic technology products, with a market cap of NT$87.03 billion.
Operations: The company's revenue is primarily derived from its Linear Guideway segment, contributing NT$15.05 billion, followed by the Ball Screw segment at NT$4.67 billion.
Insider Ownership: 13.1%
Revenue Growth Forecast: 10.9% p.a.
Hiwin Technologies is projected to achieve significant earnings growth of 25.9% annually, surpassing Taiwan's market average of 6.1%. However, its revenue growth forecast at 10.9% per year lags behind its earnings trajectory but still outpaces the market's 2.1%. Recent financial results show a slight decline in sales but an increase in net income and EPS compared to last year, indicating operational resilience despite challenges. Insider trading activity remains stable with no substantial buying or selling reported recently.
- Get an in-depth perspective on Hiwin Technologies' performance by reading our analyst estimates report here.
- According our valuation report, there's an indication that Hiwin Technologies' share price might be on the expensive side.
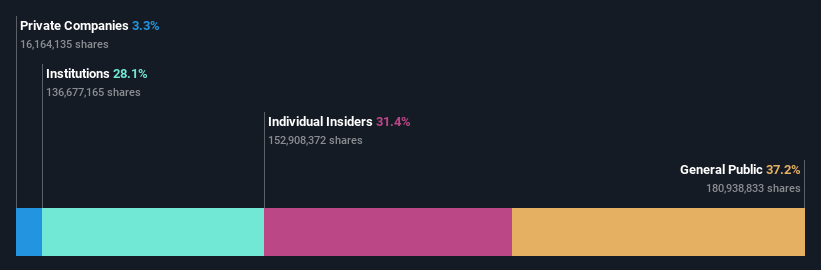
Gold Circuit Electronics (TWSE:2368)
Simply Wall St Growth Rating: ★★★★☆☆
Overview: Gold Circuit Electronics Ltd. is a Taiwanese company that designs, manufactures, processes, and distributes multilayer printed circuit boards, with a market cap of NT$117.05 billion.
Operations: The company generates revenue of NT$37.63 billion from its manufacturing and sales of printed circuit boards segment.
Insider Ownership: 31.4%
Revenue Growth Forecast: 14.1% p.a.
Gold Circuit Electronics demonstrates robust growth potential, with earnings projected to rise 19% annually, outpacing Taiwan's market average. The company reported strong Q3 2024 results, with sales reaching TWD 10.46 billion and net income at TWD 1.60 billion, reflecting significant year-over-year increases. Despite a price-to-earnings ratio of 20.9x being slightly below the market average, insider trading activity remains stable without significant recent buying or selling activity noted.
- Dive into the specifics of Gold Circuit Electronics here with our thorough growth forecast report.
- Our valuation report unveils the possibility Gold Circuit Electronics' shares may be trading at a discount.
Taking Advantage
- Dive into all 1539 of the Fast Growing Companies With High Insider Ownership we have identified here.
- Hold shares in these firms? Setup your portfolio in Simply Wall St to seamlessly track your investments and receive personalized updates on your portfolio's performance.
- Elevate your portfolio with Simply Wall St, the ultimate app for investors seeking global market coverage.
Want To Explore Some Alternatives?
- Explore high-performing small cap companies that haven't yet garnered significant analyst attention.
- Diversify your portfolio with solid dividend payers offering reliable income streams to weather potential market turbulence.
- Find companies with promising cash flow potential yet trading below their fair value.
This article by Simply Wall St is general in nature. We provide commentary based on historical data and analyst forecasts only using an unbiased methodology and our articles are not intended to be financial advice. It does not constitute a recommendation to buy or sell any stock, and does not take account of your objectives, or your financial situation. We aim to bring you long-term focused analysis driven by fundamental data. Note that our analysis may not factor in the latest price-sensitive company announcements or qualitative material. Simply Wall St has no position in any stocks mentioned.The analysis only considers stock directly held by insiders. It does not include indirectly owned stock through other vehicles such as corporate and/or trust entities. All forecast revenue and earnings growth rates quoted are in terms of annualised (per annum) growth rates over 1-3 years.
If you're looking to trade Hiwin Technologies, open an account with the lowest-cost platform trusted by professionals, Interactive Brokers.
With clients in over 200 countries and territories, and access to 160 markets, IBKR lets you trade stocks, options, futures, forex, bonds and funds from a single integrated account.
Enjoy no hidden fees, no account minimums, and FX conversion rates as low as 0.03%, far better than what most brokers offer.
Sponsored ContentValuation is complex, but we're here to simplify it.
Discover if Hiwin Technologies might be undervalued or overvalued with our detailed analysis, featuring fair value estimates, potential risks, dividends, insider trades, and its financial condition.
Access Free AnalysisHave feedback on this article? Concerned about the content? Get in touch with us directly. Alternatively, email editorial-team@simplywallst.com
About TWSE:2049
Hiwin Technologies
Manufactures and sells motion control and systematic technology products.
Flawless balance sheet with reasonable growth potential.
Similar Companies
Market Insights

Community Narratives

