
Advertisement
- South Korea
- /
- Semiconductors
- /
- KOSDAQ:A161580
Revenues Not Telling The Story For Philoptics Co., Ltd. (KOSDAQ:161580) After Shares Rise 29%
Those holding Philoptics Co., Ltd. (KOSDAQ:161580) shares would be relieved that the share price has rebounded 29% in the last thirty days, but it needs to keep going to repair the recent damage it has caused to investor portfolios. Looking back a bit further, it's encouraging to see the stock is up 96% in the last year.
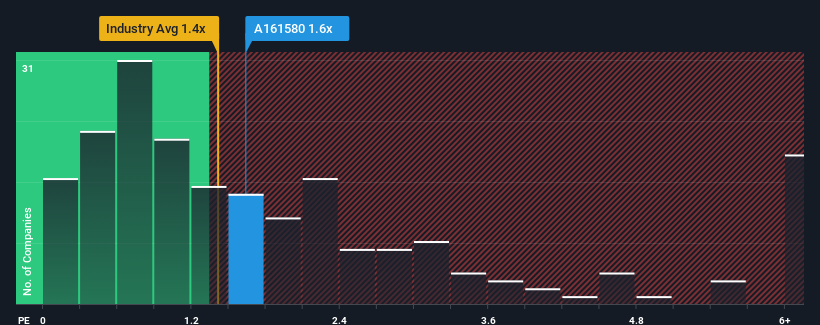
Even after such a large jump in price, it's still not a stretch to say that Philoptics' price-to-sales (or "P/S") ratio of 1.6x right now seems quite "middle-of-the-road" compared to the Semiconductor industry in Korea, where the median P/S ratio is around 1.4x. Although, it's not wise to simply ignore the P/S without explanation as investors may be disregarding a distinct opportunity or a costly mistake.
See our latest analysis for Philoptics
What Does Philoptics' Recent Performance Look Like?
For example, consider that Philoptics' financial performance has been poor lately as its revenue has been in decline. It might be that many expect the company to put the disappointing revenue performance behind them over the coming period, which has kept the P/S from falling. If you like the company, you'd at least be hoping this is the case so that you could potentially pick up some stock while it's not quite in favour.
Want the full picture on earnings, revenue and cash flow for the company? Then our free report on Philoptics will help you shine a light on its historical performance.What Are Revenue Growth Metrics Telling Us About The P/S?
Philoptics' P/S ratio would be typical for a company that's only expected to deliver moderate growth, and importantly, perform in line with the industry.
Taking a look back first, the company's revenue growth last year wasn't something to get excited about as it posted a disappointing decline of 19%. Still, the latest three year period has seen an excellent 81% overall rise in revenue, in spite of its unsatisfying short-term performance. Accordingly, while they would have preferred to keep the run going, shareholders would definitely welcome the medium-term rates of revenue growth.
Comparing the recent medium-term revenue trends against the industry's one-year growth forecast of 67% shows it's noticeably less attractive.
In light of this, it's curious that Philoptics' P/S sits in line with the majority of other companies. Apparently many investors in the company are less bearish than recent times would indicate and aren't willing to let go of their stock right now. They may be setting themselves up for future disappointment if the P/S falls to levels more in line with recent growth rates.
The Bottom Line On Philoptics' P/S
Philoptics appears to be back in favour with a solid price jump bringing its P/S back in line with other companies in the industry Using the price-to-sales ratio alone to determine if you should sell your stock isn't sensible, however it can be a practical guide to the company's future prospects.
Our examination of Philoptics revealed its poor three-year revenue trends aren't resulting in a lower P/S as per our expectations, given they look worse than current industry outlook. When we see weak revenue with slower than industry growth, we suspect the share price is at risk of declining, bringing the P/S back in line with expectations. Unless there is a significant improvement in the company's medium-term performance, it will be difficult to prevent the P/S ratio from declining to a more reasonable level.
Before you settle on your opinion, we've discovered 3 warning signs for Philoptics that you should be aware of.
If you're unsure about the strength of Philoptics' business, why not explore our interactive list of stocks with solid business fundamentals for some other companies you may have missed.
New: Manage All Your Stock Portfolios in One Place
We've created the ultimate portfolio companion for stock investors, and it's free.
• Connect an unlimited number of Portfolios and see your total in one currency
• Be alerted to new Warning Signs or Risks via email or mobile
• Track the Fair Value of your stocks
Have feedback on this article? Concerned about the content? Get in touch with us directly. Alternatively, email editorial-team (at) simplywallst.com.
This article by Simply Wall St is general in nature. We provide commentary based on historical data and analyst forecasts only using an unbiased methodology and our articles are not intended to be financial advice. It does not constitute a recommendation to buy or sell any stock, and does not take account of your objectives, or your financial situation. We aim to bring you long-term focused analysis driven by fundamental data. Note that our analysis may not factor in the latest price-sensitive company announcements or qualitative material. Simply Wall St has no position in any stocks mentioned.
About KOSDAQ:A161580
Philoptics
Manufactures and sells OLED display laser processing equipment in South Korea and internationally.
Flawless balance sheet and fair value.
Market Insights

Advertisement
Community Narratives
The Next Phase of Energy Storage: How NeoVolta Is Tackling America’s Power Crunch
Fair Value US$7.50|35.1% undervalued
MA
Community Contributor
Why EnSilica is Worth Possibly 13x its Current Price
Fair Value UK£5.00|89.8% undervalued
DO
Community Contributor
M&A Activity, Industry Diversification & A Defense Contract Monopoly Will Push BWXT For Healthy Long-Term Growth
Fair Value US$220.00|15.2% undervalued
CL
Community Contributor
A case for Cassiar Gold Corp (TSXV: GLDC) to reach CAD$8-10 before 2030 (X30-37)
Fair Value CA$10.00|96.0% undervalued
AG
Community Contributor