
Advertisement
- South Korea
- /
- Semiconductors
- /
- KOSDAQ:A080580
Investors Could Be Concerned With OKins ElectronicsLtd's (KOSDAQ:080580) Returns On Capital
To find a multi-bagger stock, what are the underlying trends we should look for in a business? Amongst other things, we'll want to see two things; firstly, a growing return on capital employed (ROCE) and secondly, an expansion in the company's amount of capital employed. Ultimately, this demonstrates that it's a business that is reinvesting profits at increasing rates of return. In light of that, when we looked at OKins ElectronicsLtd (KOSDAQ:080580) and its ROCE trend, we weren't exactly thrilled.
Return On Capital Employed (ROCE): What Is It?
Just to clarify if you're unsure, ROCE is a metric for evaluating how much pre-tax income (in percentage terms) a company earns on the capital invested in its business. The formula for this calculation on OKins ElectronicsLtd is:
Return on Capital Employed = Earnings Before Interest and Tax (EBIT) ÷ (Total Assets - Current Liabilities)
0.015 = ₩697m ÷ (₩89b - ₩44b) (Based on the trailing twelve months to September 2024).
So, OKins ElectronicsLtd has an ROCE of 1.6%. In absolute terms, that's a low return and it also under-performs the Semiconductor industry average of 6.4%.
View our latest analysis for OKins ElectronicsLtd
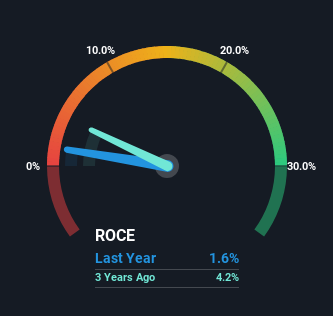
Historical performance is a great place to start when researching a stock so above you can see the gauge for OKins ElectronicsLtd's ROCE against it's prior returns. If you're interested in investigating OKins ElectronicsLtd's past further, check out this free graph covering OKins ElectronicsLtd's past earnings, revenue and cash flow.
What Can We Tell From OKins ElectronicsLtd's ROCE Trend?
On the surface, the trend of ROCE at OKins ElectronicsLtd doesn't inspire confidence. To be more specific, ROCE has fallen from 7.0% over the last five years. However, given capital employed and revenue have both increased it appears that the business is currently pursuing growth, at the consequence of short term returns. And if the increased capital generates additional returns, the business, and thus shareholders, will benefit in the long run.
On a side note, OKins ElectronicsLtd's current liabilities are still rather high at 50% of total assets. This can bring about some risks because the company is basically operating with a rather large reliance on its suppliers or other sorts of short-term creditors. Ideally we'd like to see this reduce as that would mean fewer obligations bearing risks.
In Conclusion...
Even though returns on capital have fallen in the short term, we find it promising that revenue and capital employed have both increased for OKins ElectronicsLtd. And the stock has done incredibly well with a 226% return over the last five years, so long term investors are no doubt ecstatic with that result. So while the underlying trends could already be accounted for by investors, we still think this stock is worth looking into further.
On a final note, we found 2 warning signs for OKins ElectronicsLtd (1 is potentially serious) you should be aware of.
While OKins ElectronicsLtd may not currently earn the highest returns, we've compiled a list of companies that currently earn more than 25% return on equity. Check out this free list here.
New: AI Stock Screener & Alerts
Our new AI Stock Screener scans the market every day to uncover opportunities.
• Dividend Powerhouses (3%+ Yield)
• Undervalued Small Caps with Insider Buying
• High growth Tech and AI Companies
Or build your own from over 50 metrics.
Have feedback on this article? Concerned about the content? Get in touch with us directly. Alternatively, email editorial-team (at) simplywallst.com.
This article by Simply Wall St is general in nature. We provide commentary based on historical data and analyst forecasts only using an unbiased methodology and our articles are not intended to be financial advice. It does not constitute a recommendation to buy or sell any stock, and does not take account of your objectives, or your financial situation. We aim to bring you long-term focused analysis driven by fundamental data. Note that our analysis may not factor in the latest price-sensitive company announcements or qualitative material. Simply Wall St has no position in any stocks mentioned.
About KOSDAQ:A080580
OKins ElectronicsLtd
Okins Electronics Co.,Ltd. manufactures and sells semiconductor inspection sockets.
Mediocre balance sheet with very low risk.
Market Insights

Advertisement
Community Narratives
MINISO's fair value is projected at 26.69 with an anticipated PE ratio shift of 20x
Fair Value US$24.03|11.0% undervalued
BE
Community Contributor
Procter & Gamble: A Dividend Giant Facing Slowing Growth
Fair Value US$119.81|23.3% overvalued
AN
Community Contributor
Eli Lilly's Future Growth Driven by Tirzepatide and Favorable Market Conditions
Fair Value US$1.19k|13.8% undervalued
EA
Community Contributor