
Advertisement
- South Korea
- /
- Semiconductors
- /
- KOSDAQ:A068790
Did DMSLtd's (KOSDAQ:068790) Share Price Deserve to Gain 70%?
Passive investing in index funds can generate returns that roughly match the overall market. But one can do better than that by picking better than average stocks (as part of a diversified portfolio). To wit, the DMS Co.,Ltd. (KOSDAQ:068790) share price is 70% higher than it was a year ago, much better than the market return of around 28% (not including dividends) in the same period. If it can keep that out-performance up over the long term, investors will do very well! Having said that, the longer term returns aren't so impressive, with stock gaining just 25% in three years.
Check out our latest analysis for DMSLtd
There is no denying that markets are sometimes efficient, but prices do not always reflect underlying business performance. One flawed but reasonable way to assess how sentiment around a company has changed is to compare the earnings per share (EPS) with the share price.
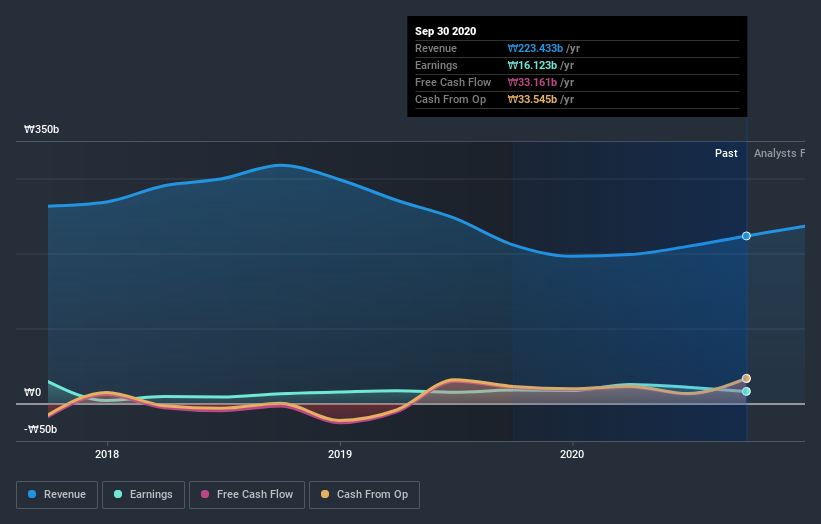
Over the last twelve months, DMSLtd actually shrank its EPS by 7.5%.
So we don't think that investors are paying too much attention to EPS. Indeed, when EPS is declining but the share price is up, it often means the market is considering other factors.
We are skeptical of the suggestion that the 0.9% dividend yield would entice buyers to the stock. We think that the revenue growth of 5.7% could have some investors interested. Many businesses do go through a phase where they have to forgo some profits to drive business development, and sometimes its for the best.
You can see below how earnings and revenue have changed over time (discover the exact values by clicking on the image).
Balance sheet strength is crucial. It might be well worthwhile taking a look at our free report on how its financial position has changed over time.
What About Dividends?
It is important to consider the total shareholder return, as well as the share price return, for any given stock. The TSR is a return calculation that accounts for the value of cash dividends (assuming that any dividend received was reinvested) and the calculated value of any discounted capital raisings and spin-offs. It's fair to say that the TSR gives a more complete picture for stocks that pay a dividend. We note that for DMSLtd the TSR over the last year was 72%, which is better than the share price return mentioned above. This is largely a result of its dividend payments!
A Different Perspective
It's good to see that DMSLtd has rewarded shareholders with a total shareholder return of 72% in the last twelve months. That's including the dividend. That's better than the annualised return of 12% over half a decade, implying that the company is doing better recently. Someone with an optimistic perspective could view the recent improvement in TSR as indicating that the business itself is getting better with time. I find it very interesting to look at share price over the long term as a proxy for business performance. But to truly gain insight, we need to consider other information, too. Consider for instance, the ever-present spectre of investment risk. We've identified 3 warning signs with DMSLtd , and understanding them should be part of your investment process.
If you are like me, then you will not want to miss this free list of growing companies that insiders are buying.
Please note, the market returns quoted in this article reflect the market weighted average returns of stocks that currently trade on KR exchanges.
If you’re looking to trade DMSLtd, open an account with the lowest-cost* platform trusted by professionals, Interactive Brokers. Their clients from over 200 countries and territories trade stocks, options, futures, forex, bonds and funds worldwide from a single integrated account. Promoted
New: Manage All Your Stock Portfolios in One Place
We've created the ultimate portfolio companion for stock investors, and it's free.
• Connect an unlimited number of Portfolios and see your total in one currency
• Be alerted to new Warning Signs or Risks via email or mobile
• Track the Fair Value of your stocks
This article by Simply Wall St is general in nature. It does not constitute a recommendation to buy or sell any stock, and does not take account of your objectives, or your financial situation. We aim to bring you long-term focused analysis driven by fundamental data. Note that our analysis may not factor in the latest price-sensitive company announcements or qualitative material. Simply Wall St has no position in any stocks mentioned.
*Interactive Brokers Rated Lowest Cost Broker by StockBrokers.com Annual Online Review 2020
Have feedback on this article? Concerned about the content? Get in touch with us directly. Alternatively, email editorial-team@simplywallst.com.
About KOSDAQ:A068790
DMSLtd
Engages in the manufacture and sale of FPD and renewable energy equipment in South Korea and internationally.
Flawless balance sheet and good value.
Market Insights

Advertisement
Community Narratives
The Next Phase of Energy Storage: How NeoVolta Is Tackling America’s Power Crunch
Fair Value US$7.50|35.2% undervalued
MA
Community Contributor
Why EnSilica is Worth Possibly 13x its Current Price
Fair Value UK£5.00|89.8% undervalued
DO
Community Contributor
M&A Activity, Industry Diversification & A Defense Contract Monopoly Will Push BWXT For Healthy Long-Term Growth
Fair Value US$220.00|15.6% undervalued
CL
Community Contributor
A case for Cassiar Gold Corp (TSXV: GLDC) to reach CAD$8-10 before 2030 (X30-37)
Fair Value CA$10.00|97.1% undervalued
AG
Community Contributor