

The external fund manager backed by Berkshire Hathaway's Charlie Munger, Li Lu, makes no bones about it when he says 'The biggest investment risk is not the volatility of prices, but whether you will suffer a permanent loss of capital.' It's only natural to consider a company's balance sheet when you examine how risky it is, since debt is often involved when a business collapses. As with many other companies Nepes Corporation (KOSDAQ:033640) makes use of debt. But the real question is whether this debt is making the company risky.
When Is Debt Dangerous?
Debt is a tool to help businesses grow, but if a business is incapable of paying off its lenders, then it exists at their mercy. If things get really bad, the lenders can take control of the business. However, a more frequent (but still costly) occurrence is where a company must issue shares at bargain-basement prices, permanently diluting shareholders, just to shore up its balance sheet. Of course, plenty of companies use debt to fund growth, without any negative consequences. The first thing to do when considering how much debt a business uses is to look at its cash and debt together.
See our latest analysis for Nepes
What Is Nepes's Net Debt?
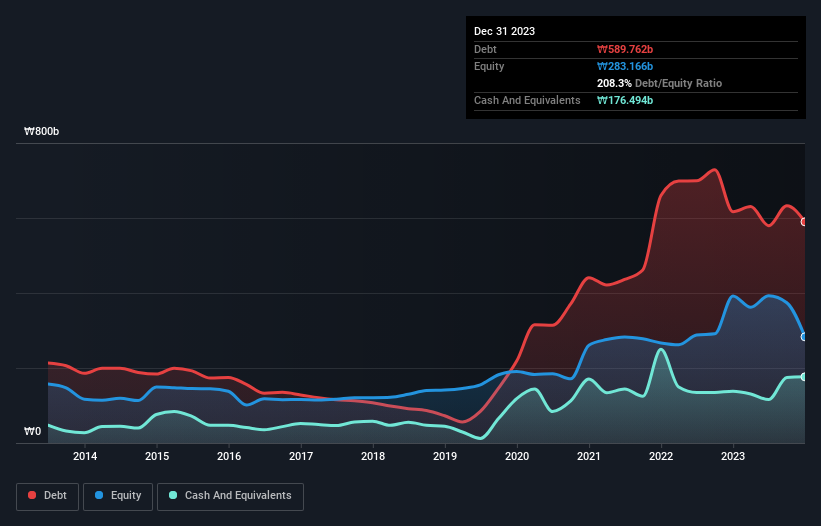
The image below, which you can click on for greater detail, shows that Nepes had debt of ₩589.8b at the end of December 2023, a reduction from ₩616.8b over a year. On the flip side, it has ₩176.5b in cash leading to net debt of about ₩413.3b.
A Look At Nepes' Liabilities
The latest balance sheet data shows that Nepes had liabilities of ₩377.3b due within a year, and liabilities of ₩302.6b falling due after that. Offsetting this, it had ₩176.5b in cash and ₩57.0b in receivables that were due within 12 months. So it has liabilities totalling ₩446.4b more than its cash and near-term receivables, combined.
Given this deficit is actually higher than the company's market capitalization of ₩424.1b, we think shareholders really should watch Nepes's debt levels, like a parent watching their child ride a bike for the first time. Hypothetically, extremely heavy dilution would be required if the company were forced to pay down its liabilities by raising capital at the current share price. The balance sheet is clearly the area to focus on when you are analysing debt. But it is Nepes's earnings that will influence how the balance sheet holds up in the future. So when considering debt, it's definitely worth looking at the earnings trend. Click here for an interactive snapshot.
Over 12 months, Nepes made a loss at the EBIT level, and saw its revenue drop to ₩480b, which is a fall of 18%. We would much prefer see growth.
Caveat Emptor
While Nepes's falling revenue is about as heartwarming as a wet blanket, arguably its earnings before interest and tax (EBIT) loss is even less appealing. Its EBIT loss was a whopping ₩70b. Considering that alongside the liabilities mentioned above make us nervous about the company. It would need to improve its operations quickly for us to be interested in it. For example, we would not want to see a repeat of last year's loss of ₩98b. In the meantime, we consider the stock to be risky. The balance sheet is clearly the area to focus on when you are analysing debt. But ultimately, every company can contain risks that exist outside of the balance sheet. For example, we've discovered 2 warning signs for Nepes that you should be aware of before investing here.
At the end of the day, it's often better to focus on companies that are free from net debt. You can access our special list of such companies (all with a track record of profit growth). It's free.
If you're looking to trade Nepes, open an account with the lowest-cost platform trusted by professionals, Interactive Brokers.
With clients in over 200 countries and territories, and access to 160 markets, IBKR lets you trade stocks, options, futures, forex, bonds and funds from a single integrated account.
Enjoy no hidden fees, no account minimums, and FX conversion rates as low as 0.03%, far better than what most brokers offer.
Sponsored ContentValuation is complex, but we're here to simplify it.
Discover if Nepes might be undervalued or overvalued with our detailed analysis, featuring fair value estimates, potential risks, dividends, insider trades, and its financial condition.
Access Free AnalysisHave feedback on this article? Concerned about the content? Get in touch with us directly. Alternatively, email editorial-team (at) simplywallst.com.
This article by Simply Wall St is general in nature. We provide commentary based on historical data and analyst forecasts only using an unbiased methodology and our articles are not intended to be financial advice. It does not constitute a recommendation to buy or sell any stock, and does not take account of your objectives, or your financial situation. We aim to bring you long-term focused analysis driven by fundamental data. Note that our analysis may not factor in the latest price-sensitive company announcements or qualitative material. Simply Wall St has no position in any stocks mentioned.
About KOSDAQ:A033640
Nepes
Engages in the semiconductor, chemical, and energy businesses in South Korea.
Low and slightly overvalued.
Market Insights

Community Narratives

