- South Korea
- /
- Semiconductors
- /
- KOSDAQ:A031980
PSK HOLDINGS (KOSDAQ:031980) sheds 7.8% this week, as yearly returns fall more in line with earnings growth


Some PSK HOLDINGS Inc. (KOSDAQ:031980) shareholders are probably rather concerned to see the share price fall 49% over the last three months. But that doesn't change the fact that the returns over the last half decade have been spectacular. To be precise, the stock price is 409% higher than it was five years ago, a wonderful performance by any measure. So we don't think the recent decline in the share price means its story is a sad one. But the real question is whether the business fundamentals can improve over the long term.
While this past week has detracted from the company's five-year return, let's look at the recent trends of the underlying business and see if the gains have been in alignment.
See our latest analysis for PSK HOLDINGS
While the efficient markets hypothesis continues to be taught by some, it has been proven that markets are over-reactive dynamic systems, and investors are not always rational. One flawed but reasonable way to assess how sentiment around a company has changed is to compare the earnings per share (EPS) with the share price.
During five years of share price growth, PSK HOLDINGS achieved compound earnings per share (EPS) growth of 18% per year. This EPS growth is slower than the share price growth of 38% per year, over the same period. This suggests that market participants hold the company in higher regard, these days. That's not necessarily surprising considering the five-year track record of earnings growth.
The graphic below depicts how EPS has changed over time (unveil the exact values by clicking on the image).
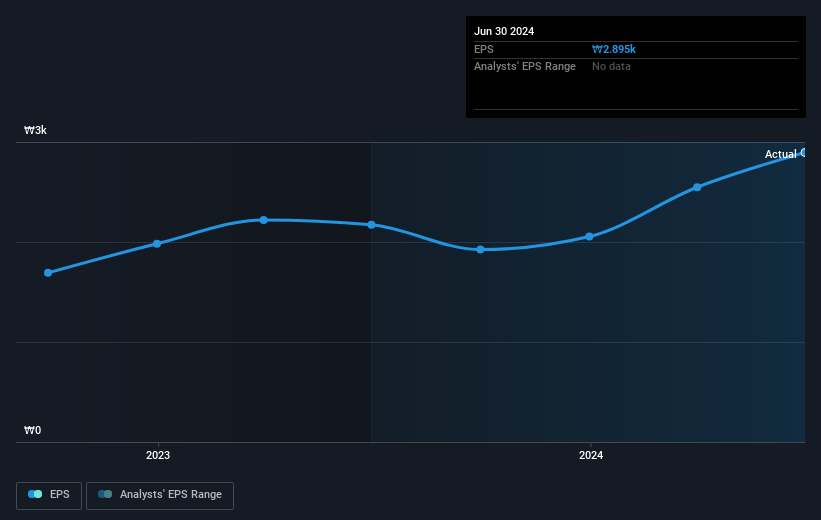
We know that PSK HOLDINGS has improved its bottom line lately, but is it going to grow revenue? You could check out this free report showing analyst revenue forecasts.
What About Dividends?
As well as measuring the share price return, investors should also consider the total shareholder return (TSR). The TSR is a return calculation that accounts for the value of cash dividends (assuming that any dividend received was reinvested) and the calculated value of any discounted capital raisings and spin-offs. Arguably, the TSR gives a more comprehensive picture of the return generated by a stock. We note that for PSK HOLDINGS the TSR over the last 5 years was 498%, which is better than the share price return mentioned above. This is largely a result of its dividend payments!
A Different Perspective
We're pleased to report that PSK HOLDINGS shareholders have received a total shareholder return of 46% over one year. And that does include the dividend. That's better than the annualised return of 43% over half a decade, implying that the company is doing better recently. In the best case scenario, this may hint at some real business momentum, implying that now could be a great time to delve deeper. It's always interesting to track share price performance over the longer term. But to understand PSK HOLDINGS better, we need to consider many other factors. To that end, you should be aware of the 4 warning signs we've spotted with PSK HOLDINGS .
If you would prefer to check out another company -- one with potentially superior financials -- then do not miss this free list of companies that have proven they can grow earnings.
Please note, the market returns quoted in this article reflect the market weighted average returns of stocks that currently trade on South Korean exchanges.
New: Manage All Your Stock Portfolios in One Place
We've created the ultimate portfolio companion for stock investors, and it's free.
• Connect an unlimited number of Portfolios and see your total in one currency
• Be alerted to new Warning Signs or Risks via email or mobile
• Track the Fair Value of your stocks
Have feedback on this article? Concerned about the content? Get in touch with us directly. Alternatively, email editorial-team (at) simplywallst.com.
This article by Simply Wall St is general in nature. We provide commentary based on historical data and analyst forecasts only using an unbiased methodology and our articles are not intended to be financial advice. It does not constitute a recommendation to buy or sell any stock, and does not take account of your objectives, or your financial situation. We aim to bring you long-term focused analysis driven by fundamental data. Note that our analysis may not factor in the latest price-sensitive company announcements or qualitative material. Simply Wall St has no position in any stocks mentioned.
About KOSDAQ:A031980
PSK HOLDINGS
Manufactures and sells semiconductor manufacturing and flat panel display equipment worldwide.
Excellent balance sheet with proven track record.

