- South Korea
- /
- Pharma
- /
- KOSE:A003060
Further weakness as Aprogen Biologics (KRX:003060) drops 13% this week, taking five-year losses to 90%

Long term investing is the way to go, but that doesn't mean you should hold every stock forever. We really hate to see fellow investors lose their hard-earned money. Spare a thought for those who held Aprogen Biologics Inc. (KRX:003060) for five whole years - as the share price tanked 93%. And we doubt long term believers are the only worried holders, since the stock price has declined 76% over the last twelve months. Shareholders have had an even rougher run lately, with the share price down 29% in the last 90 days. We really hope anyone holding through that price crash has a diversified portfolio. Even when you lose money, you don't have to lose the lesson.
Given the past week has been tough on shareholders, let's investigate the fundamentals and see what we can learn.
See our latest analysis for Aprogen Biologics
While the efficient markets hypothesis continues to be taught by some, it has been proven that markets are over-reactive dynamic systems, and investors are not always rational. One way to examine how market sentiment has changed over time is to look at the interaction between a company's share price and its earnings per share (EPS).
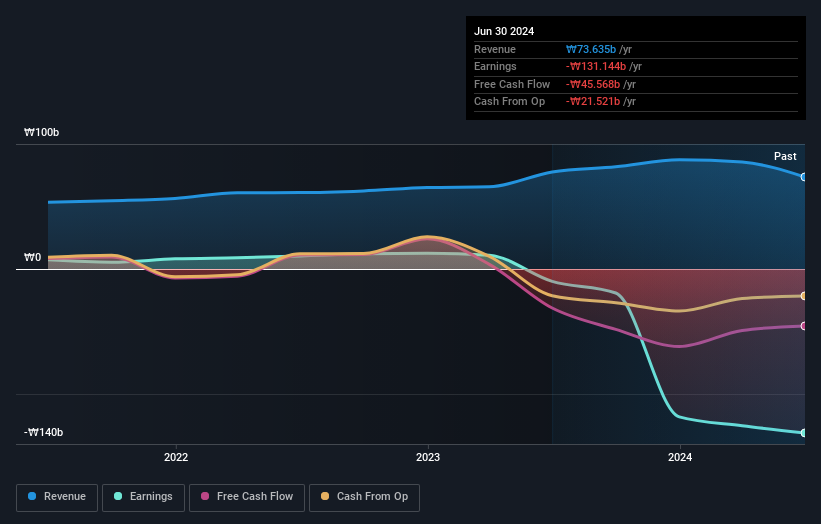
We know that Aprogen Biologics has been profitable in the past. However, it made a loss in the last twelve months, suggesting profit may be an unreliable metric at this stage. Other metrics might give us a better handle on how its value is changing over time.
Revenue is actually up 11% over the time period. A more detailed examination of the revenue and earnings may or may not explain why the share price languishes; there could be an opportunity.
You can see how earnings and revenue have changed over time in the image below (click on the chart to see the exact values).

Take a more thorough look at Aprogen Biologics' financial health with this free report on its balance sheet.
What About The Total Shareholder Return (TSR)?
We've already covered Aprogen Biologics' share price action, but we should also mention its total shareholder return (TSR). The TSR is a return calculation that accounts for the value of cash dividends (assuming that any dividend received was reinvested) and the calculated value of any discounted capital raisings and spin-offs. We note that Aprogen Biologics' TSR, at -90% is higher than its share price return of -93%. When you consider it hasn't been paying a dividend, this data suggests shareholders have benefitted from a spin-off, or had the opportunity to acquire attractively priced shares in a discounted capital raising.
A Different Perspective
While the broader market lost about 3.7% in the twelve months, Aprogen Biologics shareholders did even worse, losing 69%. However, it could simply be that the share price has been impacted by broader market jitters. It might be worth keeping an eye on the fundamentals, in case there's a good opportunity. Unfortunately, last year's performance may indicate unresolved challenges, given that it was worse than the annualised loss of 14% over the last half decade. We realise that Baron Rothschild has said investors should "buy when there is blood on the streets", but we caution that investors should first be sure they are buying a high quality business. It's always interesting to track share price performance over the longer term. But to understand Aprogen Biologics better, we need to consider many other factors. Take risks, for example - Aprogen Biologics has 2 warning signs we think you should be aware of.
Of course Aprogen Biologics may not be the best stock to buy. So you may wish to see this free collection of growth stocks.
Please note, the market returns quoted in this article reflect the market weighted average returns of stocks that currently trade on South Korean exchanges.
New: Manage All Your Stock Portfolios in One Place
We've created the ultimate portfolio companion for stock investors, and it's free.
• Connect an unlimited number of Portfolios and see your total in one currency
• Be alerted to new Warning Signs or Risks via email or mobile
• Track the Fair Value of your stocks
Have feedback on this article? Concerned about the content? Get in touch with us directly. Alternatively, email editorial-team (at) simplywallst.com.
This article by Simply Wall St is general in nature. We provide commentary based on historical data and analyst forecasts only using an unbiased methodology and our articles are not intended to be financial advice. It does not constitute a recommendation to buy or sell any stock, and does not take account of your objectives, or your financial situation. We aim to bring you long-term focused analysis driven by fundamental data. Note that our analysis may not factor in the latest price-sensitive company announcements or qualitative material. Simply Wall St has no position in any stocks mentioned.
About KOSE:A003060
Aprogen Biologics
Manufactures and sells pharmaceutical products primarily in South Korea.
Adequate balance sheet very low.
Market Insights
Community Narratives


