- South Korea
- /
- Biotech
- /
- KOSDAQ:A180400
Investors Give Dx & Vx Co., Ltd. (KOSDAQ:180400) Shares A 25% Hiding


To the annoyance of some shareholders, Dx & Vx Co., Ltd. (KOSDAQ:180400) shares are down a considerable 25% in the last month, which continues a horrid run for the company. To make matters worse, the recent drop has wiped out a year's worth of gains with the share price now back where it started a year ago.
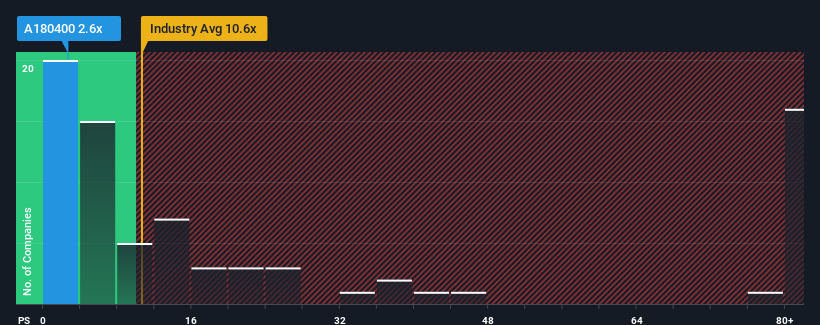
After such a large drop in price, Dx & Vx may be sending very bullish signals at the moment with its price-to-sales (or "P/S") ratio of 2.6x, since almost half of all companies in the Biotechs industry in Korea have P/S ratios greater than 10.6x and even P/S higher than 38x are not unusual. Nonetheless, we'd need to dig a little deeper to determine if there is a rational basis for the highly reduced P/S.
See our latest analysis for Dx & Vx
How Has Dx & Vx Performed Recently?
Recent times have been quite advantageous for Dx & Vx as its revenue has been rising very briskly. One possibility is that the P/S ratio is low because investors think this strong revenue growth might actually underperform the broader industry in the near future. Those who are bullish on Dx & Vx will be hoping that this isn't the case, so that they can pick up the stock at a lower valuation.
We don't have analyst forecasts, but you can see how recent trends are setting up the company for the future by checking out our free report on Dx & Vx's earnings, revenue and cash flow.How Is Dx & Vx's Revenue Growth Trending?
Dx & Vx's P/S ratio would be typical for a company that's expected to deliver very poor growth or even falling revenue, and importantly, perform much worse than the industry.
Retrospectively, the last year delivered an exceptional 77% gain to the company's top line. The latest three year period has also seen an incredible overall rise in revenue, aided by its incredible short-term performance. Accordingly, shareholders would have been over the moon with those medium-term rates of revenue growth.
When compared to the industry's one-year growth forecast of 36%, the most recent medium-term revenue trajectory is noticeably more alluring
With this information, we find it odd that Dx & Vx is trading at a P/S lower than the industry. It looks like most investors are not convinced the company can maintain its recent growth rates.
What We Can Learn From Dx & Vx's P/S?
Dx & Vx's P/S looks about as weak as its stock price lately. Typically, we'd caution against reading too much into price-to-sales ratios when settling on investment decisions, though it can reveal plenty about what other market participants think about the company.
We're very surprised to see Dx & Vx currently trading on a much lower than expected P/S since its recent three-year growth is higher than the wider industry forecast. Potential investors that are sceptical over continued revenue performance may be preventing the P/S ratio from matching previous strong performance. While recent revenue trends over the past medium-term suggest that the risk of a price decline is low, investors appear to perceive a likelihood of revenue fluctuations in the future.
Before you settle on your opinion, we've discovered 3 warning signs for Dx & Vx that you should be aware of.
If strong companies turning a profit tickle your fancy, then you'll want to check out this free list of interesting companies that trade on a low P/E (but have proven they can grow earnings).
If you're looking to trade Dx & Vx, open an account with the lowest-cost platform trusted by professionals, Interactive Brokers.
With clients in over 200 countries and territories, and access to 160 markets, IBKR lets you trade stocks, options, futures, forex, bonds and funds from a single integrated account.
Enjoy no hidden fees, no account minimums, and FX conversion rates as low as 0.03%, far better than what most brokers offer.
Sponsored ContentNew: Manage All Your Stock Portfolios in One Place
We've created the ultimate portfolio companion for stock investors, and it's free.
• Connect an unlimited number of Portfolios and see your total in one currency
• Be alerted to new Warning Signs or Risks via email or mobile
• Track the Fair Value of your stocks
Have feedback on this article? Concerned about the content? Get in touch with us directly. Alternatively, email editorial-team (at) simplywallst.com.
This article by Simply Wall St is general in nature. We provide commentary based on historical data and analyst forecasts only using an unbiased methodology and our articles are not intended to be financial advice. It does not constitute a recommendation to buy or sell any stock, and does not take account of your objectives, or your financial situation. We aim to bring you long-term focused analysis driven by fundamental data. Note that our analysis may not factor in the latest price-sensitive company announcements or qualitative material. Simply Wall St has no position in any stocks mentioned.
About KOSDAQ:A180400
Dx & Vx
Engages in the development and sale of bio-health care products and provides molecular genetic testing services primarily in South Korea.
Moderate and slightly overvalued.
Market Insights

Community Narratives

