
Advertisement
- South Korea
- /
- Biotech
- /
- KOSDAQ:A115450
What HLB Therapeutics Co.,Ltd.'s (KOSDAQ:115450) 27% Share Price Gain Is Not Telling You

Those holding HLB Therapeutics Co.,Ltd. (KOSDAQ:115450) shares would be relieved that the share price has rebounded 27% in the last thirty days, but it needs to keep going to repair the recent damage it has caused to investor portfolios. The last month tops off a massive increase of 117% in the last year.
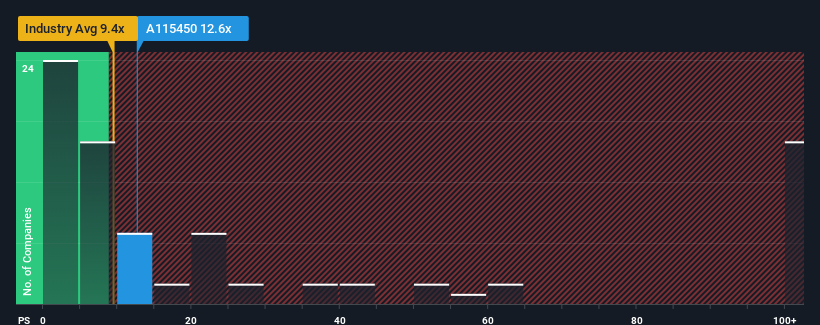
Since its price has surged higher, HLB TherapeuticsLtd may be sending bearish signals at the moment with its price-to-sales (or "P/S") ratio of 12.6x, since almost half of all companies in the Biotechs in Korea have P/S ratios under 9.4x and even P/S lower than 3x are not unusual. Although, it's not wise to just take the P/S at face value as there may be an explanation why it's as high as it is.
See our latest analysis for HLB TherapeuticsLtd
What Does HLB TherapeuticsLtd's Recent Performance Look Like?
The revenue growth achieved at HLB TherapeuticsLtd over the last year would be more than acceptable for most companies. One possibility is that the P/S ratio is high because investors think this respectable revenue growth will be enough to outperform the broader industry in the near future. If not, then existing shareholders may be a little nervous about the viability of the share price.
Although there are no analyst estimates available for HLB TherapeuticsLtd, take a look at this free data-rich visualisation to see how the company stacks up on earnings, revenue and cash flow.Is There Enough Revenue Growth Forecasted For HLB TherapeuticsLtd?
The only time you'd be truly comfortable seeing a P/S as high as HLB TherapeuticsLtd's is when the company's growth is on track to outshine the industry.
Retrospectively, the last year delivered an exceptional 20% gain to the company's top line. Pleasingly, revenue has also lifted 31% in aggregate from three years ago, thanks to the last 12 months of growth. Therefore, it's fair to say the revenue growth recently has been superb for the company.
This is in contrast to the rest of the industry, which is expected to grow by 32% over the next year, materially higher than the company's recent medium-term annualised growth rates.
With this information, we find it concerning that HLB TherapeuticsLtd is trading at a P/S higher than the industry. It seems most investors are ignoring the fairly limited recent growth rates and are hoping for a turnaround in the company's business prospects. Only the boldest would assume these prices are sustainable as a continuation of recent revenue trends is likely to weigh heavily on the share price eventually.
What Does HLB TherapeuticsLtd's P/S Mean For Investors?
HLB TherapeuticsLtd's P/S is on the rise since its shares have risen strongly. It's argued the price-to-sales ratio is an inferior measure of value within certain industries, but it can be a powerful business sentiment indicator.
Our examination of HLB TherapeuticsLtd revealed its poor three-year revenue trends aren't detracting from the P/S as much as we though, given they look worse than current industry expectations. When we see slower than industry revenue growth but an elevated P/S, there's considerable risk of the share price declining, sending the P/S lower. If recent medium-term revenue trends continue, it will place shareholders' investments at significant risk and potential investors in danger of paying an excessive premium.
We don't want to rain on the parade too much, but we did also find 2 warning signs for HLB TherapeuticsLtd (1 is significant!) that you need to be mindful of.
Of course, profitable companies with a history of great earnings growth are generally safer bets. So you may wish to see this free collection of other companies that have reasonable P/E ratios and have grown earnings strongly.
Valuation is complex, but we're here to simplify it.
Discover if HLB TherapeuticsLtd might be undervalued or overvalued with our detailed analysis, featuring fair value estimates, potential risks, dividends, insider trades, and its financial condition.
Access Free AnalysisHave feedback on this article? Concerned about the content? Get in touch with us directly. Alternatively, email editorial-team (at) simplywallst.com.
This article by Simply Wall St is general in nature. We provide commentary based on historical data and analyst forecasts only using an unbiased methodology and our articles are not intended to be financial advice. It does not constitute a recommendation to buy or sell any stock, and does not take account of your objectives, or your financial situation. We aim to bring you long-term focused analysis driven by fundamental data. Note that our analysis may not factor in the latest price-sensitive company announcements or qualitative material. Simply Wall St has no position in any stocks mentioned.
Have feedback on this article? Concerned about the content? Get in touch with us directly. Alternatively, email editorial-team@simplywallst.com
About KOSDAQ:A115450
HLB TherapeuticsLtd
A biotech company, develops pharmaceutical products in South Korea and internationally.
Flawless balance sheet minimal.
Market Insights

Advertisement
Community Narratives
Groundbreaking therapies that could change the treatment landscape for PTSD, fibromyalgia, MS & Alzheimer’s
Fair Value US$6.20|86.9% undervalued
CM
Community Contributor
DigitalOcean Will Grow 14% by Embracing AI with Paperspace Acquisition
Fair Value US$50.00|41.7% undervalued
NE
Community Contributor
Viant Technology: A Rising AdTech Challenger in the AI-Powered CTV Market
Fair Value US$38.61|63.2% undervalued
BL
Community Contributor
Volvo will Accelerate Forward into Electric and Autonomous Leadership in Five Years
Fair Value SEK 438.80|39.7% undervalued
UN
Community Contributor