- South Korea
- /
- Biotech
- /
- KOSDAQ:A115450
HLB Therapeutics Co.,Ltd.'s (KOSDAQ:115450) 38% Share Price Surge Not Quite Adding Up


Despite an already strong run, HLB Therapeutics Co.,Ltd. (KOSDAQ:115450) shares have been powering on, with a gain of 38% in the last thirty days. The last month tops off a massive increase of 148% in the last year.
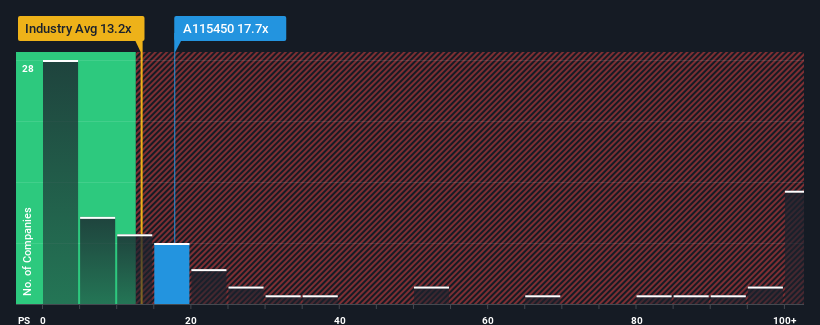
After such a large jump in price, HLB TherapeuticsLtd may be sending bearish signals at the moment with its price-to-sales (or "P/S") ratio of 17.7x, since almost half of all companies in the Biotechs in Korea have P/S ratios under 13.2x and even P/S lower than 4x are not unusual. However, the P/S might be high for a reason and it requires further investigation to determine if it's justified.
Check out our latest analysis for HLB TherapeuticsLtd
What Does HLB TherapeuticsLtd's Recent Performance Look Like?
The revenue growth achieved at HLB TherapeuticsLtd over the last year would be more than acceptable for most companies. It might be that many expect the respectable revenue performance to beat most other companies over the coming period, which has increased investors’ willingness to pay up for the stock. You'd really hope so, otherwise you're paying a pretty hefty price for no particular reason.
Although there are no analyst estimates available for HLB TherapeuticsLtd, take a look at this free data-rich visualisation to see how the company stacks up on earnings, revenue and cash flow.Is There Enough Revenue Growth Forecasted For HLB TherapeuticsLtd?
The only time you'd be truly comfortable seeing a P/S as high as HLB TherapeuticsLtd's is when the company's growth is on track to outshine the industry.
Retrospectively, the last year delivered an exceptional 27% gain to the company's top line. As a result, it also grew revenue by 25% in total over the last three years. So we can start by confirming that the company has actually done a good job of growing revenue over that time.
This is in contrast to the rest of the industry, which is expected to grow by 33% over the next year, materially higher than the company's recent medium-term annualised growth rates.
In light of this, it's alarming that HLB TherapeuticsLtd's P/S sits above the majority of other companies. Apparently many investors in the company are way more bullish than recent times would indicate and aren't willing to let go of their stock at any price. Only the boldest would assume these prices are sustainable as a continuation of recent revenue trends is likely to weigh heavily on the share price eventually.
The Key Takeaway
HLB TherapeuticsLtd's P/S is on the rise since its shares have risen strongly. Generally, our preference is to limit the use of the price-to-sales ratio to establishing what the market thinks about the overall health of a company.
The fact that HLB TherapeuticsLtd currently trades on a higher P/S relative to the industry is an oddity, since its recent three-year growth is lower than the wider industry forecast. When we observe slower-than-industry revenue growth alongside a high P/S ratio, we assume there to be a significant risk of the share price decreasing, which would result in a lower P/S ratio. If recent medium-term revenue trends continue, it will place shareholders' investments at significant risk and potential investors in danger of paying an excessive premium.
And what about other risks? Every company has them, and we've spotted 3 warning signs for HLB TherapeuticsLtd (of which 2 are a bit concerning!) you should know about.
It's important to make sure you look for a great company, not just the first idea you come across. So if growing profitability aligns with your idea of a great company, take a peek at this free list of interesting companies with strong recent earnings growth (and a low P/E).
If you're looking to trade HLB TherapeuticsLtd, open an account with the lowest-cost platform trusted by professionals, Interactive Brokers.
With clients in over 200 countries and territories, and access to 160 markets, IBKR lets you trade stocks, options, futures, forex, bonds and funds from a single integrated account.
Enjoy no hidden fees, no account minimums, and FX conversion rates as low as 0.03%, far better than what most brokers offer.
Sponsored ContentValuation is complex, but we're here to simplify it.
Discover if HLB TherapeuticsLtd might be undervalued or overvalued with our detailed analysis, featuring fair value estimates, potential risks, dividends, insider trades, and its financial condition.
Access Free AnalysisHave feedback on this article? Concerned about the content? Get in touch with us directly. Alternatively, email editorial-team (at) simplywallst.com.
This article by Simply Wall St is general in nature. We provide commentary based on historical data and analyst forecasts only using an unbiased methodology and our articles are not intended to be financial advice. It does not constitute a recommendation to buy or sell any stock, and does not take account of your objectives, or your financial situation. We aim to bring you long-term focused analysis driven by fundamental data. Note that our analysis may not factor in the latest price-sensitive company announcements or qualitative material. Simply Wall St has no position in any stocks mentioned.
About KOSDAQ:A115450
HLB TherapeuticsLtd
A biotech company, develops pharmaceutical products in South Korea and internationally.
Flawless balance sheet minimal.
Market Insights

Community Narratives

