
Advertisement
- South Korea
- /
- Biotech
- /
- KOSDAQ:A084650
LabGenomics (KOSDAQ:084650) swells 14% this week, taking five-year gains to 300%
LabGenomics Co., Ltd. (KOSDAQ:084650) shareholders have seen the share price descend 30% over the month. But that doesn't change the fact that shareholders have received really good returns over the last five years. In fact, the share price is 288% higher today. To some, the recent pullback wouldn't be surprising after such a fast rise. The more important question is whether the stock is too cheap or too expensive today. While the long term returns are impressive, we do have some sympathy for those who bought more recently, given the 44% drop, in the last year.
After a strong gain in the past week, it's worth seeing if longer term returns have been driven by improving fundamentals.
View our latest analysis for LabGenomics
In his essay The Superinvestors of Graham-and-Doddsville Warren Buffett described how share prices do not always rationally reflect the value of a business. One imperfect but simple way to consider how the market perception of a company has shifted is to compare the change in the earnings per share (EPS) with the share price movement.
LabGenomics' earnings per share are down 18% per year, despite strong share price performance over five years.
Essentially, it doesn't seem likely that investors are focused on EPS. Since the change in EPS doesn't seem to correlate with the change in share price, it's worth taking a look at other metrics.
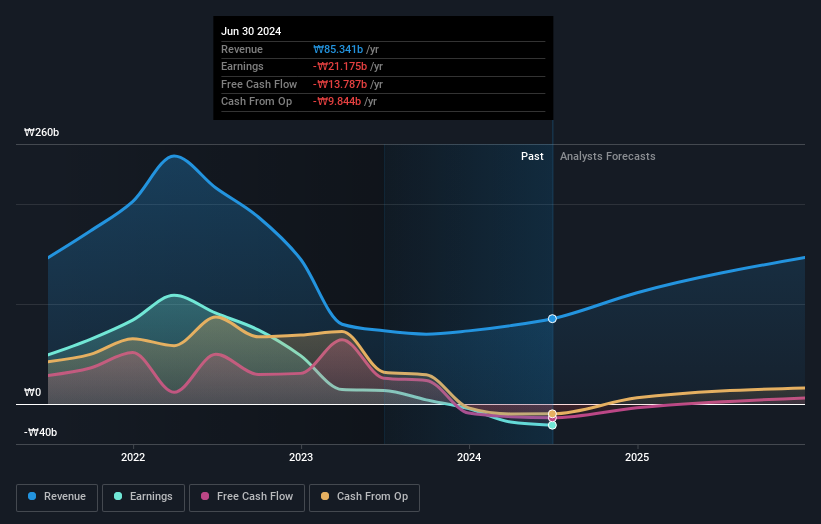
It is not great to see that revenue has dropped by per year over five years. It certainly surprises us that the share price is up, but perhaps a closer examination of the data will yield answers.
You can see below how earnings and revenue have changed over time (discover the exact values by clicking on the image).
If you are thinking of buying or selling LabGenomics stock, you should check out this FREE detailed report on its balance sheet.
What About The Total Shareholder Return (TSR)?
We've already covered LabGenomics' share price action, but we should also mention its total shareholder return (TSR). The TSR attempts to capture the value of dividends (as if they were reinvested) as well as any spin-offs or discounted capital raisings offered to shareholders. Its history of dividend payouts mean that LabGenomics' TSR of 300% over the last 5 years is better than the share price return.
A Different Perspective
While the broader market lost about 1.2% in the twelve months, LabGenomics shareholders did even worse, losing 44%. Having said that, it's inevitable that some stocks will be oversold in a falling market. The key is to keep your eyes on the fundamental developments. On the bright side, long term shareholders have made money, with a gain of 32% per year over half a decade. If the fundamental data continues to indicate long term sustainable growth, the current sell-off could be an opportunity worth considering. It's always interesting to track share price performance over the longer term. But to understand LabGenomics better, we need to consider many other factors. For example, we've discovered 2 warning signs for LabGenomics that you should be aware of before investing here.
If you like to buy stocks alongside management, then you might just love this free list of companies. (Hint: many of them are unnoticed AND have attractive valuation).
Please note, the market returns quoted in this article reflect the market weighted average returns of stocks that currently trade on South Korean exchanges.
New: AI Stock Screener & Alerts
Our new AI Stock Screener scans the market every day to uncover opportunities.
• Dividend Powerhouses (3%+ Yield)
• Undervalued Small Caps with Insider Buying
• High growth Tech and AI Companies
Or build your own from over 50 metrics.
Have feedback on this article? Concerned about the content? Get in touch with us directly. Alternatively, email editorial-team (at) simplywallst.com.
This article by Simply Wall St is general in nature. We provide commentary based on historical data and analyst forecasts only using an unbiased methodology and our articles are not intended to be financial advice. It does not constitute a recommendation to buy or sell any stock, and does not take account of your objectives, or your financial situation. We aim to bring you long-term focused analysis driven by fundamental data. Note that our analysis may not factor in the latest price-sensitive company announcements or qualitative material. Simply Wall St has no position in any stocks mentioned.
About KOSDAQ:A084650
LabGenomics
Engages in the research and development of biotechnology products in South Korea.
Mediocre balance sheet and slightly overvalued.
Market Insights

Advertisement
Community Narratives
MicroVision will explode future revenue by 380.37% with a vision towards success
Fair Value US$60.00|98.4% undervalued
TH
Community Contributor
The Indispensable Artery for a New North American Economy
Fair Value CA$132.87|1.3% undervalued
TI
Community Contributor