
Advertisement
- South Korea
- /
- Entertainment
- /
- KOSE:A352820
HYBE Co., Ltd. (KRX:352820) Stock's Been Sliding But Fundamentals Look Decent: Will The Market Correct The Share Price In The Future?

HYBE (KRX:352820) has had a rough three months with its share price down 5.3%. However, stock prices are usually driven by a company’s financials over the long term, which in this case look pretty respectable. Particularly, we will be paying attention to HYBE's ROE today.
ROE or return on equity is a useful tool to assess how effectively a company can generate returns on the investment it received from its shareholders. Simply put, it is used to assess the profitability of a company in relation to its equity capital.
Check out our latest analysis for HYBE
How Do You Calculate Return On Equity?
ROE can be calculated by using the formula:
Return on Equity = Net Profit (from continuing operations) ÷ Shareholders' Equity
So, based on the above formula, the ROE for HYBE is:
5.4% = ₩172b ÷ ₩3.2t (Based on the trailing twelve months to March 2024).
The 'return' is the amount earned after tax over the last twelve months. That means that for every ₩1 worth of shareholders' equity, the company generated ₩0.05 in profit.
What Is The Relationship Between ROE And Earnings Growth?
We have already established that ROE serves as an efficient profit-generating gauge for a company's future earnings. Based on how much of its profits the company chooses to reinvest or "retain", we are then able to evaluate a company's future ability to generate profits. Assuming everything else remains unchanged, the higher the ROE and profit retention, the higher the growth rate of a company compared to companies that don't necessarily bear these characteristics.
HYBE's Earnings Growth And 5.4% ROE
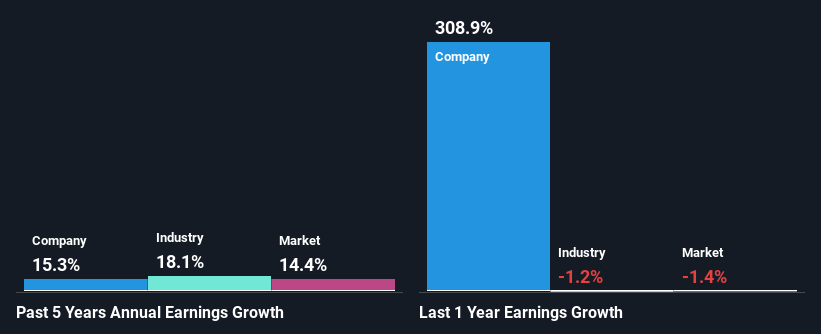
When you first look at it, HYBE's ROE doesn't look that attractive. A quick further study shows that the company's ROE doesn't compare favorably to the industry average of 8.0% either. However, the moderate 15% net income growth seen by HYBE over the past five years is definitely a positive. So, there might be other aspects that are positively influencing the company's earnings growth. Such as - high earnings retention or an efficient management in place.
We then performed a comparison between HYBE's net income growth with the industry, which revealed that the company's growth is similar to the average industry growth of 18% in the same 5-year period.
Earnings growth is a huge factor in stock valuation. The investor should try to establish if the expected growth or decline in earnings, whichever the case may be, is priced in. This then helps them determine if the stock is placed for a bright or bleak future. Has the market priced in the future outlook for A352820? You can find out in our latest intrinsic value infographic research report.
Is HYBE Using Its Retained Earnings Effectively?
In HYBE's case, its respectable earnings growth can probably be explained by its low three-year median payout ratio of 16% (or a retention ratio of 84%), which suggests that the company is investing most of its profits to grow its business.
Based on the latest analysts' estimates, we found that the company's future payout ratio over the next three years is expected to hold steady at 14%. Regardless, the future ROE for HYBE is predicted to rise to 11% despite there being not much change expected in its payout ratio.
Summary
Overall, we feel that HYBE certainly does have some positive factors to consider. Even in spite of the low rate of return, the company has posted impressive earnings growth as a result of reinvesting heavily into its business. That being so, the latest analyst forecasts show that the company will continue to see an expansion in its earnings. To know more about the company's future earnings growth forecasts take a look at this free report on analyst forecasts for the company to find out more.
Valuation is complex, but we're here to simplify it.
Discover if HYBE might be undervalued or overvalued with our detailed analysis, featuring fair value estimates, potential risks, dividends, insider trades, and its financial condition.
Access Free AnalysisHave feedback on this article? Concerned about the content? Get in touch with us directly. Alternatively, email editorial-team (at) simplywallst.com.
This article by Simply Wall St is general in nature. We provide commentary based on historical data and analyst forecasts only using an unbiased methodology and our articles are not intended to be financial advice. It does not constitute a recommendation to buy or sell any stock, and does not take account of your objectives, or your financial situation. We aim to bring you long-term focused analysis driven by fundamental data. Note that our analysis may not factor in the latest price-sensitive company announcements or qualitative material. Simply Wall St has no position in any stocks mentioned.
Have feedback on this article? Concerned about the content? Get in touch with us directly. Alternatively, email editorial-team@simplywallst.com
About KOSE:A352820
HYBE
Engages in the music production, publishing, and artist development and management businesses.
Excellent balance sheet with reasonable growth potential.
Market Insights

Advertisement
Community Narratives
WhiteCap Is Positioned To Profit Regardless Of Trump's Policy 
Fair Value CA$22.60|61.6% undervalued
ST
Equity Analyst and Writer
Microsoft's Evolution Will Drive Revenue to New Heights Fueled by AI
Fair Value US$360.00|29.9% overvalued
BR
Community Contributor
A CASE FOR USD$2.50 (CAD$3.44) BY 2028 (A 5-10 BAGGER)
Fair Value CA$3.44|87.8% undervalued
AG
Community Contributor