

Howard Marks put it nicely when he said that, rather than worrying about share price volatility, 'The possibility of permanent loss is the risk I worry about... and every practical investor I know worries about.' So it seems the smart money knows that debt - which is usually involved in bankruptcies - is a very important factor, when you assess how risky a company is. Importantly, Mr. Blue Corporation (KOSDAQ:207760) does carry debt. But the real question is whether this debt is making the company risky.
Why Does Debt Bring Risk?
Debt assists a business until the business has trouble paying it off, either with new capital or with free cash flow. Part and parcel of capitalism is the process of 'creative destruction' where failed businesses are mercilessly liquidated by their bankers. However, a more usual (but still expensive) situation is where a company must dilute shareholders at a cheap share price simply to get debt under control. Of course, the upside of debt is that it often represents cheap capital, especially when it replaces dilution in a company with the ability to reinvest at high rates of return. When we examine debt levels, we first consider both cash and debt levels, together.
Check out our latest analysis for Mr. Blue
What Is Mr. Blue's Net Debt?
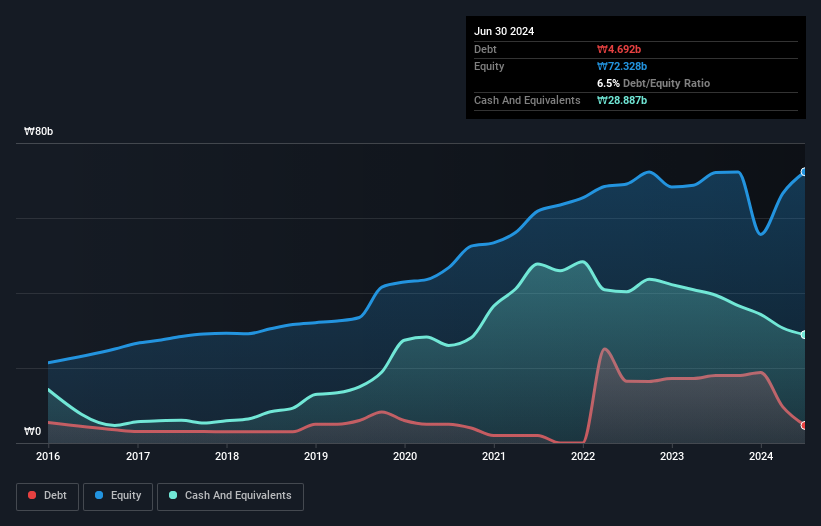
You can click the graphic below for the historical numbers, but it shows that Mr. Blue had ₩4.69b of debt in June 2024, down from ₩18.0b, one year before. However, its balance sheet shows it holds ₩28.9b in cash, so it actually has ₩24.2b net cash.
How Healthy Is Mr. Blue's Balance Sheet?
Zooming in on the latest balance sheet data, we can see that Mr. Blue had liabilities of ₩33.9b due within 12 months and liabilities of ₩5.26b due beyond that. Offsetting these obligations, it had cash of ₩28.9b as well as receivables valued at ₩8.15b due within 12 months. So it has liabilities totalling ₩2.13b more than its cash and near-term receivables, combined.
Having regard to Mr. Blue's size, it seems that its liquid assets are well balanced with its total liabilities. So it's very unlikely that the ₩120.1b company is short on cash, but still worth keeping an eye on the balance sheet. While it does have liabilities worth noting, Mr. Blue also has more cash than debt, so we're pretty confident it can manage its debt safely. When analysing debt levels, the balance sheet is the obvious place to start. But you can't view debt in total isolation; since Mr. Blue will need earnings to service that debt. So when considering debt, it's definitely worth looking at the earnings trend. Click here for an interactive snapshot.
Over 12 months, Mr. Blue made a loss at the EBIT level, and saw its revenue drop to ₩68b, which is a fall of 16%. That's not what we would hope to see.
So How Risky Is Mr. Blue?
We have no doubt that loss making companies are, in general, riskier than profitable ones. And in the last year Mr. Blue had an earnings before interest and tax (EBIT) loss, truth be told. Indeed, in that time it burnt through ₩11b of cash and made a loss of ₩18b. With only ₩24.2b on the balance sheet, it would appear that its going to need to raise capital again soon. Summing up, we're a little skeptical of this one, as it seems fairly risky in the absence of free cashflow. When analysing debt levels, the balance sheet is the obvious place to start. However, not all investment risk resides within the balance sheet - far from it. Case in point: We've spotted 3 warning signs for Mr. Blue you should be aware of, and 1 of them is potentially serious.
If you're interested in investing in businesses that can grow profits without the burden of debt, then check out this free list of growing businesses that have net cash on the balance sheet.
New: Manage All Your Stock Portfolios in One Place
We've created the ultimate portfolio companion for stock investors, and it's free.
• Connect an unlimited number of Portfolios and see your total in one currency
• Be alerted to new Warning Signs or Risks via email or mobile
• Track the Fair Value of your stocks
Have feedback on this article? Concerned about the content? Get in touch with us directly. Alternatively, email editorial-team (at) simplywallst.com.
This article by Simply Wall St is general in nature. We provide commentary based on historical data and analyst forecasts only using an unbiased methodology and our articles are not intended to be financial advice. It does not constitute a recommendation to buy or sell any stock, and does not take account of your objectives, or your financial situation. We aim to bring you long-term focused analysis driven by fundamental data. Note that our analysis may not factor in the latest price-sensitive company announcements or qualitative material. Simply Wall St has no position in any stocks mentioned.
About KOSDAQ:A207760
Mr. Blue
Operates as an entertainment company in South Korea and internationally.
Adequate balance sheet low.
Market Insights

Community Narratives

