
Advertisement

The market seemed underwhelmed by last week's earnings announcement from KX Innovation Co., Ltd. (KOSDAQ:122450) despite the healthy numbers. We did some digging, and we think that investors are missing some encouraging factors in the underlying numbers.
Check out our latest analysis for KX Innovation
Examining Cashflow Against KX Innovation's Earnings
In high finance, the key ratio used to measure how well a company converts reported profits into free cash flow (FCF) is the accrual ratio (from cashflow). The accrual ratio subtracts the FCF from the profit for a given period, and divides the result by the average operating assets of the company over that time. This ratio tells us how much of a company's profit is not backed by free cashflow.
Therefore, it's actually considered a good thing when a company has a negative accrual ratio, but a bad thing if its accrual ratio is positive. While having an accrual ratio above zero is of little concern, we do think it's worth noting when a company has a relatively high accrual ratio. Notably, there is some academic evidence that suggests that a high accrual ratio is a bad sign for near-term profits, generally speaking.
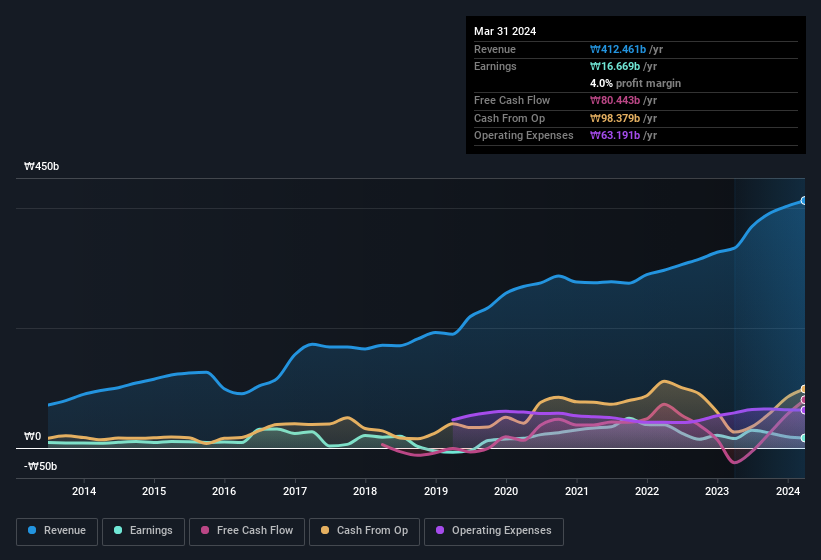
Over the twelve months to March 2024, KX Innovation recorded an accrual ratio of -0.13. That implies it has good cash conversion, and implies that its free cash flow solidly exceeded its profit last year. Indeed, in the last twelve months it reported free cash flow of ₩80b, well over the ₩16.7b it reported in profit. Notably, KX Innovation had negative free cash flow last year, so the ₩80b it produced this year was a welcome improvement.
Note: we always recommend investors check balance sheet strength. Click here to be taken to our balance sheet analysis of KX Innovation.
Our Take On KX Innovation's Profit Performance
As we discussed above, KX Innovation has perfectly satisfactory free cash flow relative to profit. Based on this observation, we consider it likely that KX Innovation's statutory profit actually understates its earnings potential! And the EPS is up 7.7% over the last twelve months. Of course, we've only just scratched the surface when it comes to analysing its earnings; one could also consider margins, forecast growth, and return on investment, among other factors. If you want to do dive deeper into KX Innovation, you'd also look into what risks it is currently facing. For example, we've discovered 1 warning sign that you should run your eye over to get a better picture of KX Innovation.
Today we've zoomed in on a single data point to better understand the nature of KX Innovation's profit. But there is always more to discover if you are capable of focussing your mind on minutiae. For example, many people consider a high return on equity as an indication of favorable business economics, while others like to 'follow the money' and search out stocks that insiders are buying. So you may wish to see this free collection of companies boasting high return on equity, or this list of stocks with high insider ownership.
Valuation is complex, but we're here to simplify it.
Discover if KX Innovation might be undervalued or overvalued with our detailed analysis, featuring fair value estimates, potential risks, dividends, insider trades, and its financial condition.
Access Free AnalysisHave feedback on this article? Concerned about the content? Get in touch with us directly. Alternatively, email editorial-team (at) simplywallst.com.
This article by Simply Wall St is general in nature. We provide commentary based on historical data and analyst forecasts only using an unbiased methodology and our articles are not intended to be financial advice. It does not constitute a recommendation to buy or sell any stock, and does not take account of your objectives, or your financial situation. We aim to bring you long-term focused analysis driven by fundamental data. Note that our analysis may not factor in the latest price-sensitive company announcements or qualitative material. Simply Wall St has no position in any stocks mentioned.
About KOSDAQ:A122450
Undervalued with solid track record and pays a dividend.
Market Insights

Advertisement
Community Narratives

BMW cruising ahead with new EVs and premium models to boost revenue 5%
Fair Value €135.07|44.6% undervalued
UN
Community Contributor
EU#2 - From Humble Beginnings to Global Powerhouse
Fair Value DKK 851.04|46.4% undervalued
TO
Community Contributor