
Advertisement
- South Korea
- /
- Interactive Media and Services
- /
- KOSDAQ:A046140
How Do SBS Contents Hub Co., Ltd.’s (KOSDAQ:046140) Returns On Capital Compare To Peers?

Today we'll evaluate SBS Contents Hub Co., Ltd. (KOSDAQ:046140) to determine whether it could have potential as an investment idea. To be precise, we'll consider its Return On Capital Employed (ROCE), as that will inform our view of the quality of the business.
First up, we'll look at what ROCE is and how we calculate it. Second, we'll look at its ROCE compared to similar companies. Then we'll determine how its current liabilities are affecting its ROCE.
Understanding Return On Capital Employed (ROCE)
ROCE measures the amount of pre-tax profits a company can generate from the capital employed in its business. All else being equal, a better business will have a higher ROCE. In brief, it is a useful tool, but it is not without drawbacks. Author Edwin Whiting says to be careful when comparing the ROCE of different businesses, since 'No two businesses are exactly alike.
How Do You Calculate Return On Capital Employed?
Analysts use this formula to calculate return on capital employed:
Return on Capital Employed = Earnings Before Interest and Tax (EBIT) ÷ (Total Assets - Current Liabilities)
Or for SBS Contents Hub:
0.041 = ₩6.6b ÷ (₩202b - ₩40b) (Based on the trailing twelve months to September 2019.)
Therefore, SBS Contents Hub has an ROCE of 4.1%.
See our latest analysis for SBS Contents Hub
Does SBS Contents Hub Have A Good ROCE?
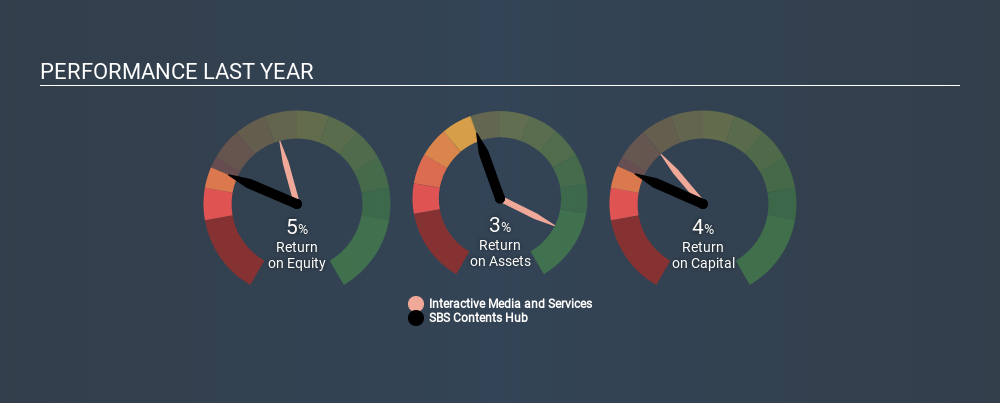
ROCE can be useful when making comparisons, such as between similar companies. We can see SBS Contents Hub's ROCE is meaningfully below the Interactive Media and Services industry average of 16%. This could be seen as a negative, as it suggests some competitors may be employing their capital more efficiently. Independently of how SBS Contents Hub compares to its industry, its ROCE in absolute terms is low; especially compared to the ~3.4% available in government bonds. There are potentially more appealing investments elsewhere.
SBS Contents Hub's current ROCE of 4.1% is lower than 3 years ago, when the company reported a 7.2% ROCE. Therefore we wonder if the company is facing new headwinds. The image below shows how SBS Contents Hub's ROCE compares to its industry, and you can click it to see more detail on its past growth.
Remember that this metric is backwards looking - it shows what has happened in the past, and does not accurately predict the future. ROCE can be misleading for companies in cyclical industries, with returns looking impressive during the boom times, but very weak during the busts. ROCE is only a point-in-time measure. Since the future is so important for investors, you should check out our free report on analyst forecasts for SBS Contents Hub.
SBS Contents Hub's Current Liabilities And Their Impact On Its ROCE
Current liabilities include invoices, such as supplier payments, short-term debt, or a tax bill, that need to be paid within 12 months. Due to the way the ROCE equation works, having large bills due in the near term can make it look as though a company has less capital employed, and thus a higher ROCE than usual. To counteract this, we check if a company has high current liabilities, relative to its total assets.
SBS Contents Hub has total liabilities of ₩40b and total assets of ₩202b. Therefore its current liabilities are equivalent to approximately 20% of its total assets. This is not a high level of current liabilities, which would not boost the ROCE by much.
Our Take On SBS Contents Hub's ROCE
SBS Contents Hub has a poor ROCE, and there may be better investment prospects out there. Of course, you might also be able to find a better stock than SBS Contents Hub. So you may wish to see this free collection of other companies that have grown earnings strongly.
I will like SBS Contents Hub better if I see some big insider buys. While we wait, check out this free list of growing companies with considerable, recent, insider buying.
If you spot an error that warrants correction, please contact the editor at editorial-team@simplywallst.com. This article by Simply Wall St is general in nature. It does not constitute a recommendation to buy or sell any stock, and does not take account of your objectives, or your financial situation. Simply Wall St has no position in the stocks mentioned.
We aim to bring you long-term focused research analysis driven by fundamental data. Note that our analysis may not factor in the latest price-sensitive company announcements or qualitative material. Thank you for reading.
About KOSDAQ:A046140
SBS Contents Hub
SBS Contents Hub Co., Ltd. engages in the content distribution business in South Korea and internationally.
Flawless balance sheet unattractive dividend payer.
Market Insights


Advertisement
Community Narratives
The Future of Drug Testing? Fingerprint Tech Shows Serious Promise
Fair Value US$2.98|40.3% undervalued
JO
Community Contributor
Suncorp’s Next Chapter: Insurance-Only and Ready to Grow
Fair Value AU$22.83|7.9% undervalued
RO
Community Contributor
Thyssenkrupp Nucera Will Achieve Double-Digit Profits by 2030 Boosted by Hydrogen Growth
Fair Value €14.40|31.6% undervalued
CH
Community Contributor
Tesla’s Nvidia Moment – The AI & Robotics Inflection Point
Fair Value US$359.72|12.3% undervalued
BL
Community Contributor