
Advertisement
David Iben put it well when he said, 'Volatility is not a risk we care about. What we care about is avoiding the permanent loss of capital.' So it seems the smart money knows that debt - which is usually involved in bankruptcies - is a very important factor, when you assess how risky a company is. As with many other companies OCI Company Ltd. (KRX:456040) makes use of debt. But should shareholders be worried about its use of debt?
When Is Debt A Problem?
Debt is a tool to help businesses grow, but if a business is incapable of paying off its lenders, then it exists at their mercy. If things get really bad, the lenders can take control of the business. While that is not too common, we often do see indebted companies permanently diluting shareholders because lenders force them to raise capital at a distressed price. Of course, the upside of debt is that it often represents cheap capital, especially when it replaces dilution in a company with the ability to reinvest at high rates of return. When we think about a company's use of debt, we first look at cash and debt together.
How Much Debt Does OCI Carry?
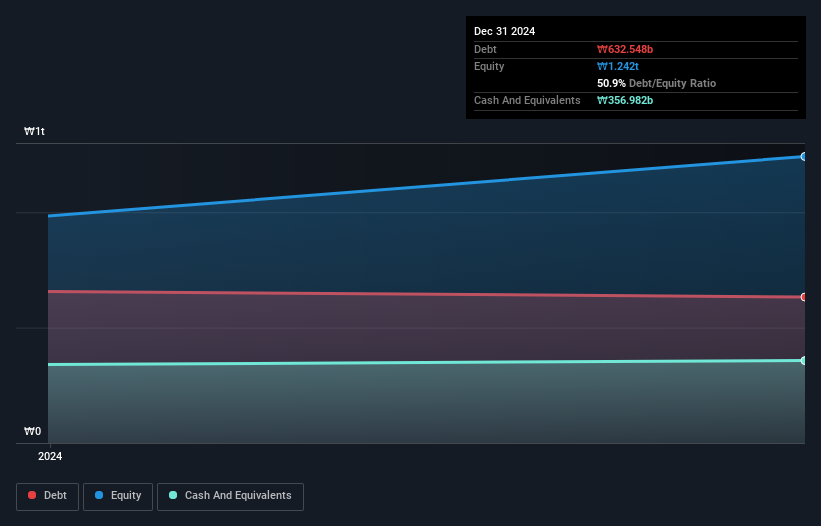
As you can see below, OCI had ₩632.5b of debt, at December 2024, which is about the same as the year before. You can click the chart for greater detail. However, it does have ₩357.0b in cash offsetting this, leading to net debt of about ₩275.6b.
How Healthy Is OCI's Balance Sheet?
Zooming in on the latest balance sheet data, we can see that OCI had liabilities of ₩612.4b due within 12 months and liabilities of ₩429.1b due beyond that. Offsetting this, it had ₩357.0b in cash and ₩327.8b in receivables that were due within 12 months. So it has liabilities totalling ₩356.6b more than its cash and near-term receivables, combined.
This deficit is considerable relative to its market capitalization of ₩440.9b, so it does suggest shareholders should keep an eye on OCI's use of debt. This suggests shareholders would be heavily diluted if the company needed to shore up its balance sheet in a hurry.
See our latest analysis for OCI
We measure a company's debt load relative to its earnings power by looking at its net debt divided by its earnings before interest, tax, depreciation, and amortization (EBITDA) and by calculating how easily its earnings before interest and tax (EBIT) cover its interest expense (interest cover). Thus we consider debt relative to earnings both with and without depreciation and amortization expenses.
While OCI's low debt to EBITDA ratio of 1.5 suggests only modest use of debt, the fact that EBIT only covered the interest expense by 5.9 times last year does give us pause. So we'd recommend keeping a close eye on the impact financing costs are having on the business. Also relevant is that OCI has grown its EBIT by a very respectable 29% in the last year, thus enhancing its ability to pay down debt. There's no doubt that we learn most about debt from the balance sheet. But you can't view debt in total isolation; since OCI will need earnings to service that debt. So when considering debt, it's definitely worth looking at the earnings trend. Click here for an interactive snapshot .
Finally, while the tax-man may adore accounting profits, lenders only accept cold hard cash. So we clearly need to look at whether that EBIT is leading to corresponding free cash flow. During the last two years, OCI generated free cash flow amounting to a very robust 87% of its EBIT, more than we'd expect. That puts it in a very strong position to pay down debt.
Our View
The good news is that OCI's demonstrated ability to convert EBIT to free cash flow delights us like a fluffy puppy does a toddler. But, on a more sombre note, we are a little concerned by its level of total liabilities. All these things considered, it appears that OCI can comfortably handle its current debt levels. Of course, while this leverage can enhance returns on equity, it does bring more risk, so it's worth keeping an eye on this one. The balance sheet is clearly the area to focus on when you are analysing debt. However, not all investment risk resides within the balance sheet - far from it. For example - OCI has 1 warning sign we think you should be aware of.
If, after all that, you're more interested in a fast growing company with a rock-solid balance sheet, then check out our list of net cash growth stocks without delay.
New: AI Stock Screener & Alerts
Our new AI Stock Screener scans the market every day to uncover opportunities.
• Dividend Powerhouses (3%+ Yield)
• Undervalued Small Caps with Insider Buying
• High growth Tech and AI Companies
Or build your own from over 50 metrics.
Have feedback on this article? Concerned about the content? Get in touch with us directly. Alternatively, email editorial-team (at) simplywallst.com.
This article by Simply Wall St is general in nature. We provide commentary based on historical data and analyst forecasts only using an unbiased methodology and our articles are not intended to be financial advice. It does not constitute a recommendation to buy or sell any stock, and does not take account of your objectives, or your financial situation. We aim to bring you long-term focused analysis driven by fundamental data. Note that our analysis may not factor in the latest price-sensitive company announcements or qualitative material. Simply Wall St has no position in any stocks mentioned.
About KOSE:A456040
OCI
Engages in the manufacture and sell polysilicon, carbon black, and related products.
Moderate risk and slightly overvalued.
Market Insights

Advertisement
Community Narratives
MINISO's fair value is projected at 26.69 with an anticipated PE ratio shift of 20x
Fair Value US$24.03|11.0% undervalued
BE
Community Contributor
Procter & Gamble: A Dividend Giant Facing Slowing Growth
Fair Value US$119.81|23.3% overvalued
AN
Community Contributor
Eli Lilly's Future Growth Driven by Tirzepatide and Favorable Market Conditions
Fair Value US$1.19k|13.8% undervalued
EA
Community Contributor