
Advertisement
- South Korea
- /
- Metals and Mining
- /
- KOSE:A025820
Market Might Still Lack Some Conviction On Lee Ku Industrial Co., Ltd. (KRX:025820) Even After 41% Share Price Boost
Lee Ku Industrial Co., Ltd. (KRX:025820) shares have continued their recent momentum with a 41% gain in the last month alone. Unfortunately, despite the strong performance over the last month, the full year gain of 5.8% isn't as attractive.
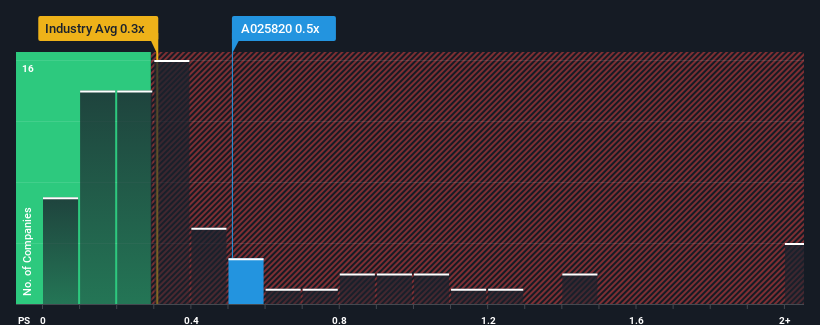
In spite of the firm bounce in price, there still wouldn't be many who think Lee Ku Industrial's price-to-sales (or "P/S") ratio of 0.5x is worth a mention when the median P/S in Korea's Metals and Mining industry is similar at about 0.3x. Although, it's not wise to simply ignore the P/S without explanation as investors may be disregarding a distinct opportunity or a costly mistake.
See our latest analysis for Lee Ku Industrial
What Does Lee Ku Industrial's Recent Performance Look Like?
We'd have to say that with no tangible growth over the last year, Lee Ku Industrial's revenue has been unimpressive. It might be that many expect the uninspiring revenue performance to only match most other companies at best over the coming period, which has kept the P/S from rising. Those who are bullish on Lee Ku Industrial will be hoping that this isn't the case, so that they can pick up the stock at a lower valuation.
Want the full picture on earnings, revenue and cash flow for the company? Then our free report on Lee Ku Industrial will help you shine a light on its historical performance.Is There Some Revenue Growth Forecasted For Lee Ku Industrial?
The only time you'd be comfortable seeing a P/S like Lee Ku Industrial's is when the company's growth is tracking the industry closely.
Retrospectively, the last year delivered virtually the same number to the company's top line as the year before. However, a few strong years before that means that it was still able to grow revenue by an impressive 114% in total over the last three years. Accordingly, shareholders will be pleased, but also have some questions to ponder about the last 12 months.
When compared to the industry's one-year growth forecast of 12%, the most recent medium-term revenue trajectory is noticeably more alluring
With this information, we find it interesting that Lee Ku Industrial is trading at a fairly similar P/S compared to the industry. It may be that most investors are not convinced the company can maintain its recent growth rates.
What We Can Learn From Lee Ku Industrial's P/S?
Its shares have lifted substantially and now Lee Ku Industrial's P/S is back within range of the industry median. Generally, our preference is to limit the use of the price-to-sales ratio to establishing what the market thinks about the overall health of a company.
To our surprise, Lee Ku Industrial revealed its three-year revenue trends aren't contributing to its P/S as much as we would have predicted, given they look better than current industry expectations. There could be some unobserved threats to revenue preventing the P/S ratio from matching this positive performance. It appears some are indeed anticipating revenue instability, because the persistence of these recent medium-term conditions would normally provide a boost to the share price.
Having said that, be aware Lee Ku Industrial is showing 4 warning signs in our investment analysis, and 1 of those is a bit concerning.
If strong companies turning a profit tickle your fancy, then you'll want to check out this free list of interesting companies that trade on a low P/E (but have proven they can grow earnings).
New: AI Stock Screener & Alerts
Our new AI Stock Screener scans the market every day to uncover opportunities.
• Dividend Powerhouses (3%+ Yield)
• Undervalued Small Caps with Insider Buying
• High growth Tech and AI Companies
Or build your own from over 50 metrics.
Have feedback on this article? Concerned about the content? Get in touch with us directly. Alternatively, email editorial-team (at) simplywallst.com.
This article by Simply Wall St is general in nature. We provide commentary based on historical data and analyst forecasts only using an unbiased methodology and our articles are not intended to be financial advice. It does not constitute a recommendation to buy or sell any stock, and does not take account of your objectives, or your financial situation. We aim to bring you long-term focused analysis driven by fundamental data. Note that our analysis may not factor in the latest price-sensitive company announcements or qualitative material. Simply Wall St has no position in any stocks mentioned.
About KOSE:A025820
Lee Ku Industrial
Operates in the non-ferrous material industry in South Korea.
Solid track record and good value.
Market Insights

Advertisement
Community Narratives
MINISO's fair value is projected at 26.69 with an anticipated PE ratio shift of 20x
Fair Value US$24.03|11.0% undervalued
BE
Community Contributor
Procter & Gamble: A Dividend Giant Facing Slowing Growth
Fair Value US$119.81|23.3% overvalued
AN
Community Contributor
Eli Lilly's Future Growth Driven by Tirzepatide and Favorable Market Conditions
Fair Value US$1.19k|13.8% undervalued
EA
Community Contributor