
Advertisement
- South Korea
- /
- Chemicals
- /
- KOSE:A011790
Despite shrinking by ₩177b in the past week, SKC (KRX:011790) shareholders are still up 95% over 5 years

The last three months have been tough on SKC Co., Ltd. (KRX:011790) shareholders, who have seen the share price decline a rather worrying 39%. On the bright side the returns have been quite good over the last half decade. It has returned a market beating 89% in that time.
Although SKC has shed ₩177b from its market cap this week, let's take a look at its longer term fundamental trends and see if they've driven returns.
We've discovered 1 warning sign about SKC. View them for free.SKC wasn't profitable in the last twelve months, it is unlikely we'll see a strong correlation between its share price and its earnings per share (EPS). Arguably revenue is our next best option. Generally speaking, companies without profits are expected to grow revenue every year, and at a good clip. That's because fast revenue growth can be easily extrapolated to forecast profits, often of considerable size.
Over the last half decade SKC's revenue has actually been trending down at about 9.8% per year. Despite the lack of revenue growth, the stock has returned a respectable 14%, compound, over that time. To us that suggests that there probably isn't a lot of correlation between the past revenue performance and the share price, but a closer look at analyst forecasts and the bottom line may well explain a lot.
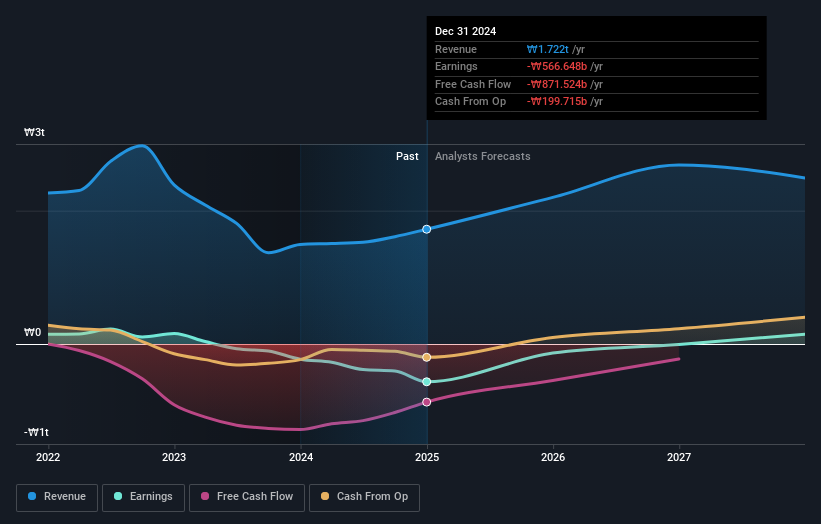
The image below shows how earnings and revenue have tracked over time (if you click on the image you can see greater detail).
SKC is a well known stock, with plenty of analyst coverage, suggesting some visibility into future growth. So it makes a lot of sense to check out what analysts think SKC will earn in the future (free analyst consensus estimates)
What About The Total Shareholder Return (TSR)?
We'd be remiss not to mention the difference between SKC's total shareholder return (TSR) and its share price return. Arguably the TSR is a more complete return calculation because it accounts for the value of dividends (as if they were reinvested), along with the hypothetical value of any discounted capital that have been offered to shareholders. SKC's TSR of 95% for the 5 years exceeded its share price return, because it has paid dividends.
A Different Perspective
While the broader market lost about 5.5% in the twelve months, SKC shareholders did even worse, losing 14%. Having said that, it's inevitable that some stocks will be oversold in a falling market. The key is to keep your eyes on the fundamental developments. Longer term investors wouldn't be so upset, since they would have made 14%, each year, over five years. It could be that the recent sell-off is an opportunity, so it may be worth checking the fundamental data for signs of a long term growth trend. It's always interesting to track share price performance over the longer term. But to understand SKC better, we need to consider many other factors. Consider risks, for instance. Every company has them, and we've spotted 1 warning sign for SKC you should know about.
Of course, you might find a fantastic investment by looking elsewhere. So take a peek at this free list of companies we expect will grow earnings.
Please note, the market returns quoted in this article reflect the market weighted average returns of stocks that currently trade on South Korean exchanges.
New: Manage All Your Stock Portfolios in One Place
We've created the ultimate portfolio companion for stock investors, and it's free.
• Connect an unlimited number of Portfolios and see your total in one currency
• Be alerted to new Warning Signs or Risks via email or mobile
• Track the Fair Value of your stocks
Have feedback on this article? Concerned about the content? Get in touch with us directly. Alternatively, email editorial-team (at) simplywallst.com.
This article by Simply Wall St is general in nature. We provide commentary based on historical data and analyst forecasts only using an unbiased methodology and our articles are not intended to be financial advice. It does not constitute a recommendation to buy or sell any stock, and does not take account of your objectives, or your financial situation. We aim to bring you long-term focused analysis driven by fundamental data. Note that our analysis may not factor in the latest price-sensitive company announcements or qualitative material. Simply Wall St has no position in any stocks mentioned.
About KOSE:A011790
SKC
Manufactures and sells basic chemical raw materials and copper foils for batteries.
Reasonable growth potential minimal.
Similar Companies
Market Insights

Advertisement
Community Narratives
Groundbreaking therapies that could change the treatment landscape for PTSD, fibromyalgia, MS & Alzheimer’s
Fair Value US$6.20|86.9% undervalued
CM
Community Contributor
DigitalOcean Will Grow 14% by Embracing AI with Paperspace Acquisition
Fair Value US$50.00|41.7% undervalued
NE
Community Contributor
Viant Technology: A Rising AdTech Challenger in the AI-Powered CTV Market
Fair Value US$38.61|63.2% undervalued
BL
Community Contributor
Volvo will Accelerate Forward into Electric and Autonomous Leadership in Five Years
Fair Value SEK 438.80|39.7% undervalued
UN
Community Contributor