- South Korea
- /
- Packaging
- /
- KOSE:A008730
Youlchon Chemical Co.,Ltd.'s (KRX:008730) 25% Share Price Plunge Could Signal Some Risk
Youlchon Chemical Co.,Ltd. (KRX:008730) shares have had a horrible month, losing 25% after a relatively good period beforehand. The drop over the last 30 days has capped off a tough year for shareholders, with the share price down 33% in that time.
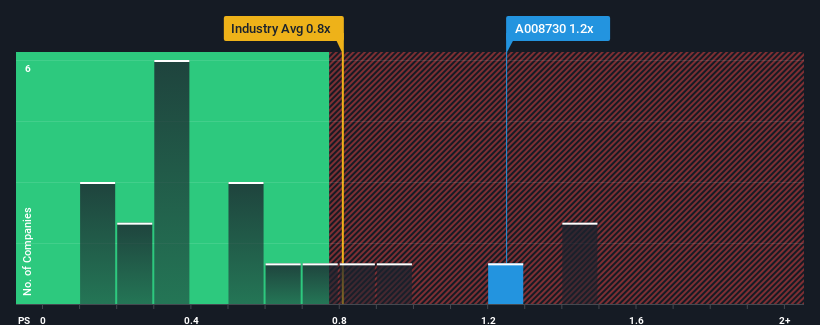
Even after such a large drop in price, when almost half of the companies in Korea's Packaging industry have price-to-sales ratios (or "P/S") below 0.3x, you may still consider Youlchon ChemicalLtd as a stock probably not worth researching with its 1.2x P/S ratio. Although, it's not wise to just take the P/S at face value as there may be an explanation why it's as high as it is.
Check out our latest analysis for Youlchon ChemicalLtd

What Does Youlchon ChemicalLtd's Recent Performance Look Like?
Revenue has risen firmly for Youlchon ChemicalLtd recently, which is pleasing to see. It might be that many expect the respectable revenue performance to beat most other companies over the coming period, which has increased investors’ willingness to pay up for the stock. If not, then existing shareholders may be a little nervous about the viability of the share price.
Want the full picture on earnings, revenue and cash flow for the company? Then our free report on Youlchon ChemicalLtd will help you shine a light on its historical performance.How Is Youlchon ChemicalLtd's Revenue Growth Trending?
The only time you'd be truly comfortable seeing a P/S as high as Youlchon ChemicalLtd's is when the company's growth is on track to outshine the industry.
If we review the last year of revenue growth, the company posted a terrific increase of 18%. However, this wasn't enough as the latest three year period has seen the company endure a nasty 17% drop in revenue in aggregate. Accordingly, shareholders would have felt downbeat about the medium-term rates of revenue growth.
In contrast to the company, the rest of the industry is expected to grow by 32% over the next year, which really puts the company's recent medium-term revenue decline into perspective.
With this in mind, we find it worrying that Youlchon ChemicalLtd's P/S exceeds that of its industry peers. It seems most investors are ignoring the recent poor growth rate and are hoping for a turnaround in the company's business prospects. Only the boldest would assume these prices are sustainable as a continuation of recent revenue trends is likely to weigh heavily on the share price eventually.
What We Can Learn From Youlchon ChemicalLtd's P/S?
There's still some elevation in Youlchon ChemicalLtd's P/S, even if the same can't be said for its share price recently. While the price-to-sales ratio shouldn't be the defining factor in whether you buy a stock or not, it's quite a capable barometer of revenue expectations.
We've established that Youlchon ChemicalLtd currently trades on a much higher than expected P/S since its recent revenues have been in decline over the medium-term. Right now we aren't comfortable with the high P/S as this revenue performance is highly unlikely to support such positive sentiment for long. If recent medium-term revenue trends continue, it will place shareholders' investments at significant risk and potential investors in danger of paying an excessive premium.
Don't forget that there may be other risks. For instance, we've identified 3 warning signs for Youlchon ChemicalLtd (2 are a bit unpleasant) you should be aware of.
Of course, profitable companies with a history of great earnings growth are generally safer bets. So you may wish to see this free collection of other companies that have reasonable P/E ratios and have grown earnings strongly.
New: Manage All Your Stock Portfolios in One Place
We've created the ultimate portfolio companion for stock investors, and it's free.
• Connect an unlimited number of Portfolios and see your total in one currency
• Be alerted to new Warning Signs or Risks via email or mobile
• Track the Fair Value of your stocks
Have feedback on this article? Concerned about the content? Get in touch with us directly. Alternatively, email editorial-team (at) simplywallst.com.
This article by Simply Wall St is general in nature. We provide commentary based on historical data and analyst forecasts only using an unbiased methodology and our articles are not intended to be financial advice. It does not constitute a recommendation to buy or sell any stock, and does not take account of your objectives, or your financial situation. We aim to bring you long-term focused analysis driven by fundamental data. Note that our analysis may not factor in the latest price-sensitive company announcements or qualitative material. Simply Wall St has no position in any stocks mentioned.
About KOSE:A008730
Imperfect balance sheet with very low risk.
Market Insights
Community Narratives


Recently Updated Narratives

TAV Havalimanlari Holding will fly high with 25.68% revenue growth


Fiducian: Compliance Clouds or Value Opportunity?


Q3 Outlook modestly optimistic
Popular Narratives


MicroVision will explode future revenue by 380.37% with a vision towards success


The company that turned a verb into a global necessity and basically runs the modern internet, digital ads, smartphones, maps, and AI.


