
Advertisement
- South Korea
- /
- Metals and Mining
- /
- KOSE:A005810
Insiders were the key beneficiaries as Poongsan Holdings Corporation's (KRX:005810) market cap rises to ₩601b
Key Insights
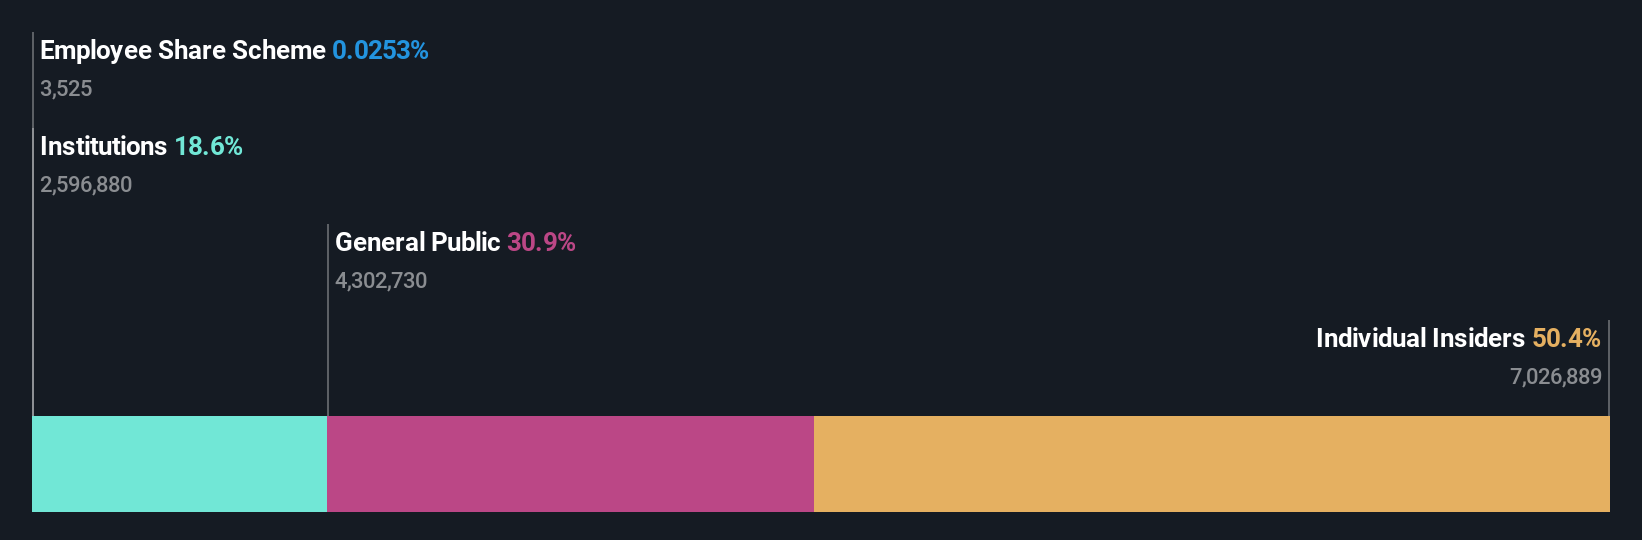
- Insiders appear to have a vested interest in Poongsan Holdings' growth, as seen by their sizeable ownership
- 50% of the company is held by a single shareholder (Jin Ryu)
- 19% of Poongsan Holdings is held by Institutions
To get a sense of who is truly in control of Poongsan Holdings Corporation (KRX:005810), it is important to understand the ownership structure of the business. The group holding the most number of shares in the company, around 50% to be precise, is individual insiders. In other words, the group stands to gain the most (or lose the most) from their investment into the company.
As a result, insiders scored the highest last week as the company hit ₩601b market cap following a 22% gain in the stock.
In the chart below, we zoom in on the different ownership groups of Poongsan Holdings.
Check out our latest analysis for Poongsan Holdings
What Does The Institutional Ownership Tell Us About Poongsan Holdings?
Many institutions measure their performance against an index that approximates the local market. So they usually pay more attention to companies that are included in major indices.
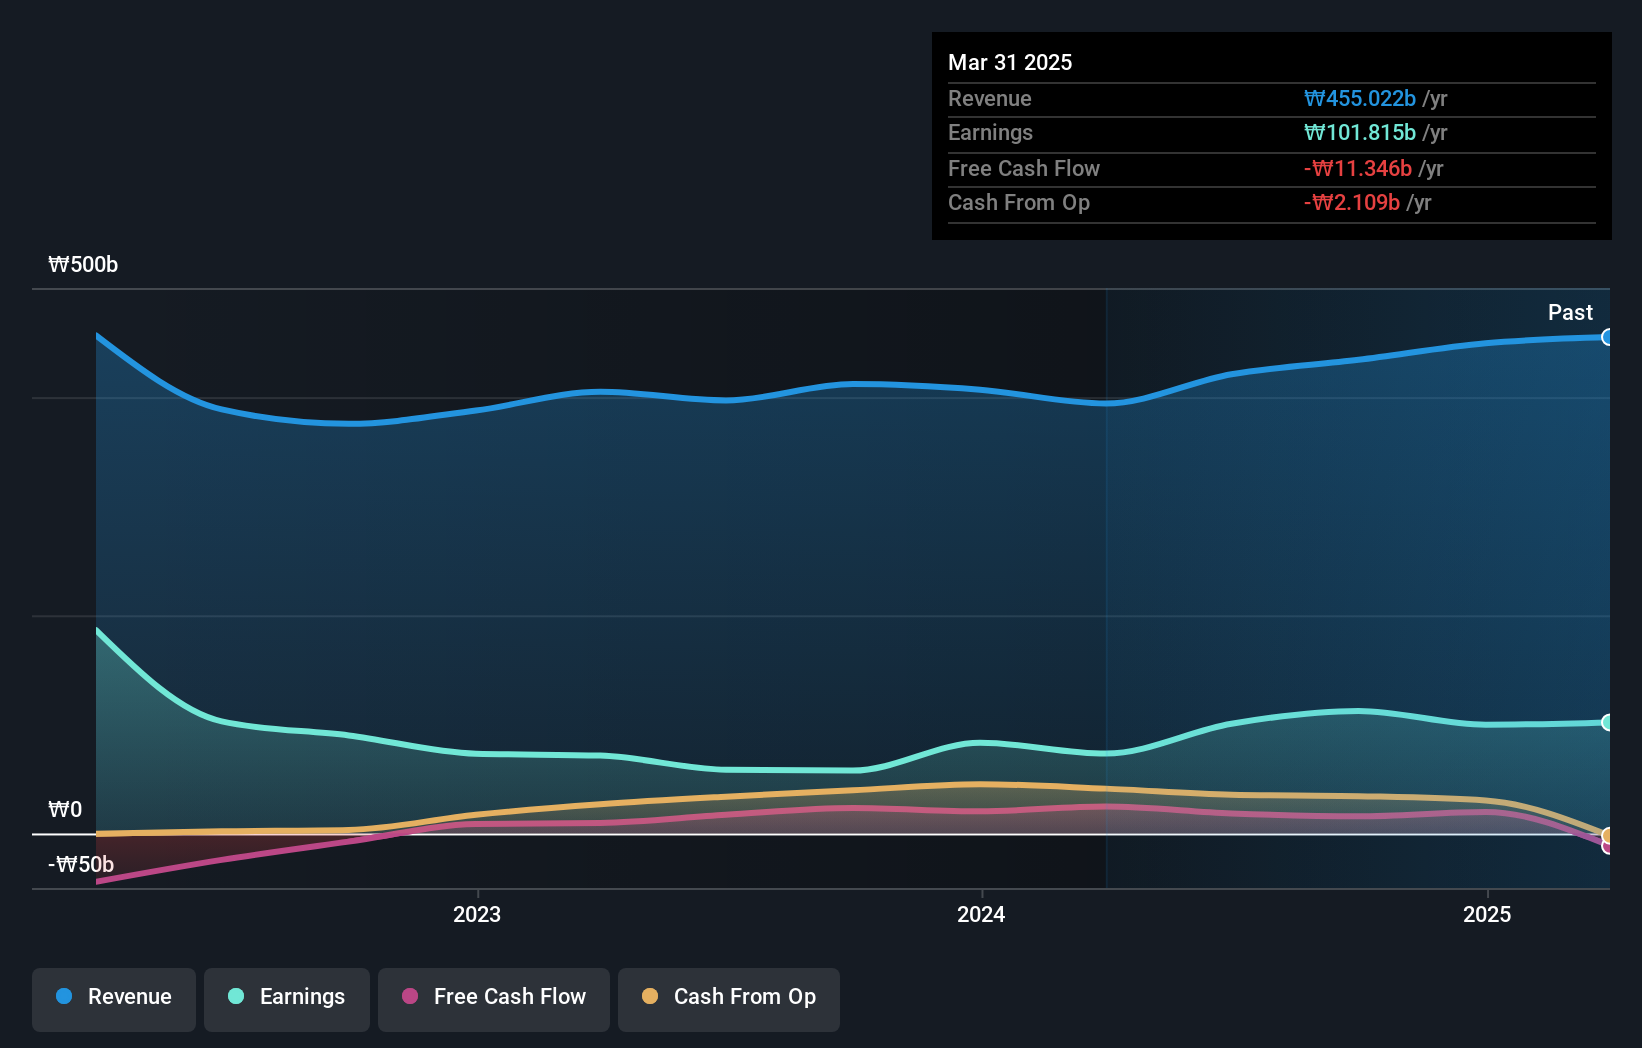
As you can see, institutional investors have a fair amount of stake in Poongsan Holdings. This suggests some credibility amongst professional investors. But we can't rely on that fact alone since institutions make bad investments sometimes, just like everyone does. It is not uncommon to see a big share price drop if two large institutional investors try to sell out of a stock at the same time. So it is worth checking the past earnings trajectory of Poongsan Holdings, (below). Of course, keep in mind that there are other factors to consider, too.
Poongsan Holdings is not owned by hedge funds. Looking at our data, we can see that the largest shareholder is Jin Ryu with 50% of shares outstanding. This essentially means that they have extensive influence, if not outright control, over the future of the corporation. Meanwhile, the second and third largest shareholders, hold 12% and 3.9%, of the shares outstanding, respectively.
While it makes sense to study institutional ownership data for a company, it also makes sense to study analyst sentiments to know which way the wind is blowing. As far as we can tell there isn't analyst coverage of the company, so it is probably flying under the radar.
Insider Ownership Of Poongsan Holdings
The definition of an insider can differ slightly between different countries, but members of the board of directors always count. Company management run the business, but the CEO will answer to the board, even if he or she is a member of it.
Insider ownership is positive when it signals leadership are thinking like the true owners of the company. However, high insider ownership can also give immense power to a small group within the company. This can be negative in some circumstances.
Our most recent data indicates that insiders own the majority of Poongsan Holdings Corporation. This means they can collectively make decisions for the company. So they have a ₩303b stake in this ₩601b business. Most would be pleased to see the board is investing alongside them. You may wish todiscover (for free) if they have been buying or selling.
General Public Ownership
With a 31% ownership, the general public, mostly comprising of individual investors, have some degree of sway over Poongsan Holdings. While this group can't necessarily call the shots, it can certainly have a real influence on how the company is run.

Next Steps:
While it is well worth considering the different groups that own a company, there are other factors that are even more important. Take risks for example - Poongsan Holdings has 1 warning sign we think you should be aware of.
If you would prefer check out another company -- one with potentially superior financials -- then do not miss this free list of interesting companies, backed by strong financial data.
NB: Figures in this article are calculated using data from the last twelve months, which refer to the 12-month period ending on the last date of the month the financial statement is dated. This may not be consistent with full year annual report figures.
New: Manage All Your Stock Portfolios in One Place
We've created the ultimate portfolio companion for stock investors, and it's free.
• Connect an unlimited number of Portfolios and see your total in one currency
• Be alerted to new Warning Signs or Risks via email or mobile
• Track the Fair Value of your stocks
Have feedback on this article? Concerned about the content? Get in touch with us directly. Alternatively, email editorial-team (at) simplywallst.com.
This article by Simply Wall St is general in nature. We provide commentary based on historical data and analyst forecasts only using an unbiased methodology and our articles are not intended to be financial advice. It does not constitute a recommendation to buy or sell any stock, and does not take account of your objectives, or your financial situation. We aim to bring you long-term focused analysis driven by fundamental data. Note that our analysis may not factor in the latest price-sensitive company announcements or qualitative material. Simply Wall St has no position in any stocks mentioned.
About KOSE:A005810
Poongsan Holdings
Manufactures and sells copper and nonferrous metal products worldwide.
Excellent balance sheet second-rate dividend payer.
Market Insights

Advertisement
Community Narratives
MicroVision will explode future revenue by 380.37% with a vision towards success
Fair Value US$60|98.4% undervalued
TH
Community Contributor
The Indispensable Artery for a New North American Economy
Fair Value CA$132.87|0.8% undervalued
TI
Community Contributor
Recently Updated Narratives
AL

AlexLovell on Rocket Lab ·
Early mover in a fast growing industry. Likely to experience share price volatility as they scale
Fair Value:US$16.25158.0% overvalued
2 followersusers have followed this narrative
0 commentsusers have commented on this narrative
0 likesusers have liked this narrative
MA


MarkoVT on ANYCOLOR ·
Near zero debt, Japan centric focus provides future growth
Fair Value:JP¥7.61k15.3% undervalued
1 followerusers have followed this narrative
0 commentsusers have commented on this narrative
0 likesusers have liked this narrative
CO

composite32 on TAV Havalimanlari Holding ·
TAV Havalimanlari Holding will fly high with 25.68% revenue growth
Fair Value:₺545.1648.6% undervalued
3 followersusers have followed this narrative
0 commentsusers have commented on this narrative
0 likesusers have liked this narrative
Popular Narratives
TH

TheWallstreetKing on MicroVision ·
MicroVision will explode future revenue by 380.37% with a vision towards success
Fair Value:US$6098.4% undervalued
97 followersusers have followed this narrative
10 commentsusers have commented on this narrative
19 likesusers have liked this narrative
OS


oscargarcia on Alphabet ·
The company that turned a verb into a global necessity and basically runs the modern internet, digital ads, smartphones, maps, and AI.
Fair Value:US$3405.9% undervalued
137 followersusers have followed this narrative
6 commentsusers have commented on this narrative
18 likesusers have liked this narrative
AN


AnalystConsensusTarget on NVIDIA ·
NVDA: Expanding AI Demand Will Drive Major Data Center Investments Through 2026
Fair Value:US$232.7922.6% undervalued
929 followersusers have followed this narrative
6 commentsusers have commented on this narrative
22 likesusers have liked this narrative