
Advertisement
- South Korea
- /
- Chemicals
- /
- KOSE:A005420
With A 26% Price Drop For Cosmo Chemical Co., Ltd. (KRX:005420) You'll Still Get What You Pay For
Unfortunately for some shareholders, the Cosmo Chemical Co., Ltd. (KRX:005420) share price has dived 26% in the last thirty days, prolonging recent pain. The recent drop completes a disastrous twelve months for shareholders, who are sitting on a 58% loss during that time.
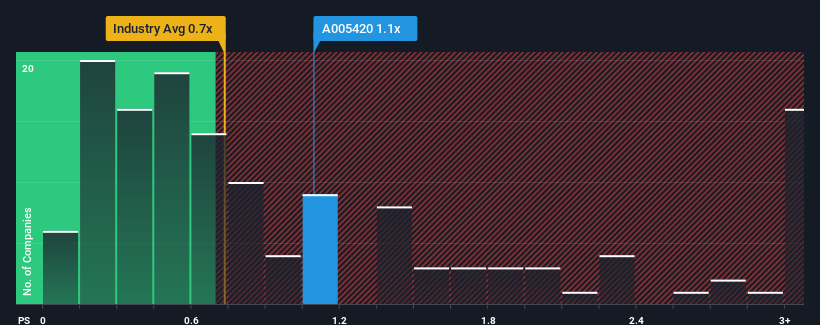
Even after such a large drop in price, it's still not a stretch to say that Cosmo Chemical's price-to-sales (or "P/S") ratio of 1.1x right now seems quite "middle-of-the-road" compared to the Chemicals industry in Korea, where the median P/S ratio is around 0.7x. While this might not raise any eyebrows, if the P/S ratio is not justified investors could be missing out on a potential opportunity or ignoring looming disappointment.
Check out our latest analysis for Cosmo Chemical
How Has Cosmo Chemical Performed Recently?
For example, consider that Cosmo Chemical's financial performance has been poor lately as its revenue has been in decline. Perhaps investors believe the recent revenue performance is enough to keep in line with the industry, which is keeping the P/S from dropping off. If you like the company, you'd at least be hoping this is the case so that you could potentially pick up some stock while it's not quite in favour.
Although there are no analyst estimates available for Cosmo Chemical, take a look at this free data-rich visualisation to see how the company stacks up on earnings, revenue and cash flow.Do Revenue Forecasts Match The P/S Ratio?
Cosmo Chemical's P/S ratio would be typical for a company that's only expected to deliver moderate growth, and importantly, perform in line with the industry.
Retrospectively, the last year delivered a frustrating 9.7% decrease to the company's top line. Even so, admirably revenue has lifted 80% in aggregate from three years ago, notwithstanding the last 12 months. Although it's been a bumpy ride, it's still fair to say the revenue growth recently has been more than adequate for the company.
Comparing that to the industry, which is predicted to deliver 22% growth in the next 12 months, the company's momentum is pretty similar based on recent medium-term annualised revenue results.
With this in consideration, it's clear to see why Cosmo Chemical's P/S matches up closely to its industry peers. It seems most investors are expecting to see average growth rates continue into the future and are only willing to pay a moderate amount for the stock.
What We Can Learn From Cosmo Chemical's P/S?
Cosmo Chemical's plummeting stock price has brought its P/S back to a similar region as the rest of the industry. Using the price-to-sales ratio alone to determine if you should sell your stock isn't sensible, however it can be a practical guide to the company's future prospects.
As we've seen, Cosmo Chemical's three-year revenue trends seem to be contributing to its P/S, given they look similar to current industry expectations. Right now shareholders are comfortable with the P/S as they are quite confident future revenue won't throw up any surprises. Unless the recent medium-term conditions change, they will continue to support the share price at these levels.
You always need to take note of risks, for example - Cosmo Chemical has 1 warning sign we think you should be aware of.
If strong companies turning a profit tickle your fancy, then you'll want to check out this free list of interesting companies that trade on a low P/E (but have proven they can grow earnings).
New: AI Stock Screener & Alerts
Our new AI Stock Screener scans the market every day to uncover opportunities.
• Dividend Powerhouses (3%+ Yield)
• Undervalued Small Caps with Insider Buying
• High growth Tech and AI Companies
Or build your own from over 50 metrics.
Have feedback on this article? Concerned about the content? Get in touch with us directly. Alternatively, email editorial-team (at) simplywallst.com.
This article by Simply Wall St is general in nature. We provide commentary based on historical data and analyst forecasts only using an unbiased methodology and our articles are not intended to be financial advice. It does not constitute a recommendation to buy or sell any stock, and does not take account of your objectives, or your financial situation. We aim to bring you long-term focused analysis driven by fundamental data. Note that our analysis may not factor in the latest price-sensitive company announcements or qualitative material. Simply Wall St has no position in any stocks mentioned.
Have feedback on this article? Concerned about the content? Get in touch with us directly. Alternatively, email editorial-team@simplywallst.com
About KOSE:A005420
Cosmo Chemical
A chemical materials company, manufactures and sells titanium dioxide (TiO2) anatase in South Korea.
Imperfect balance sheet with very low risk.
Market Insights

Advertisement
Community Narratives
MINISO's fair value is projected at 26.69 with an anticipated PE ratio shift of 20x
Fair Value US$24.03|9.0% undervalued
BE
Community Contributor
Procter & Gamble: A Dividend Giant Facing Slowing Growth
Fair Value US$119.81|23.5% overvalued
AN
Community Contributor
Eli Lilly's Future Growth Driven by Tirzepatide and Favorable Market Conditions
Fair Value US$1.19k|14.4% undervalued
EA
Community Contributor