- South Korea
- /
- Chemicals
- /
- KOSE:A001340
Paik Kwang Industrial Co., Ltd.'s (KRX:001340) Has Been On A Rise But Financial Prospects Look Weak: Is The Stock Overpriced?


Paik Kwang Industrial's (KRX:001340) stock is up by a considerable 129% over the past month. However, in this article, we decided to focus on its weak fundamentals, as long-term financial performance of a business is what ultimately dictates market outcomes. Specifically, we decided to study Paik Kwang Industrial's ROE in this article.
ROE or return on equity is a useful tool to assess how effectively a company can generate returns on the investment it received from its shareholders. In simpler terms, it measures the profitability of a company in relation to shareholder's equity.
Check out our latest analysis for Paik Kwang Industrial
How Do You Calculate Return On Equity?
Return on equity can be calculated by using the formula:
Return on Equity = Net Profit (from continuing operations) ÷ Shareholders' Equity
So, based on the above formula, the ROE for Paik Kwang Industrial is:
0.7% = ₩1.6b ÷ ₩212b (Based on the trailing twelve months to March 2024).
The 'return' is the profit over the last twelve months. Another way to think of that is that for every ₩1 worth of equity, the company was able to earn ₩0.01 in profit.
What Has ROE Got To Do With Earnings Growth?
We have already established that ROE serves as an efficient profit-generating gauge for a company's future earnings. We now need to evaluate how much profit the company reinvests or "retains" for future growth which then gives us an idea about the growth potential of the company. Assuming everything else remains unchanged, the higher the ROE and profit retention, the higher the growth rate of a company compared to companies that don't necessarily bear these characteristics.
Paik Kwang Industrial's Earnings Growth And 0.7% ROE
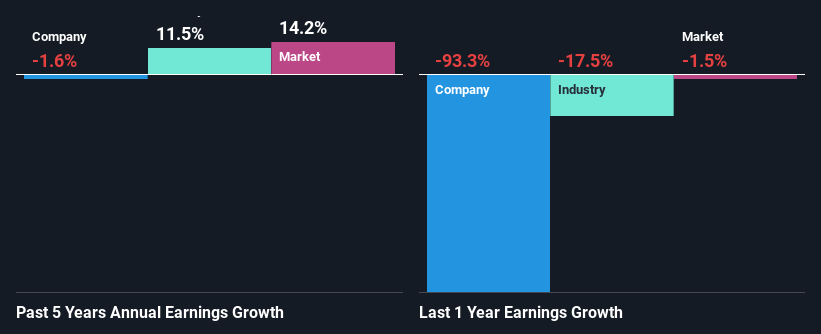
As you can see, Paik Kwang Industrial's ROE looks pretty weak. Even when compared to the industry average of 6.4%, the ROE figure is pretty disappointing. Therefore, Paik Kwang Industrial's flat earnings over the past five years can possibly be explained by the low ROE amongst other factors.
We then compared Paik Kwang Industrial's net income growth with the industry and found that the average industry growth rate was 11% in the same 5-year period.
Earnings growth is an important metric to consider when valuing a stock. It’s important for an investor to know whether the market has priced in the company's expected earnings growth (or decline). By doing so, they will have an idea if the stock is headed into clear blue waters or if swampy waters await. If you're wondering about Paik Kwang Industrial's's valuation, check out this gauge of its price-to-earnings ratio, as compared to its industry.
Is Paik Kwang Industrial Efficiently Re-investing Its Profits?
Paik Kwang Industrial has a very high three-year median payout ratio of 102% over the last last three years, which suggests that the company is dipping into more than just its earnings to pay its dividend. This does go some way in explaining the negligible earnings growth seen by Paik Kwang Industrial. Paying a dividend beyond their means is usually not viable over the long term. This is indicative of risk. To know the 5 risks we have identified for Paik Kwang Industrial visit our risks dashboard for free.
Additionally, Paik Kwang Industrial has paid dividends over a period of five years, which means that the company's management is determined to pay dividends even if it means little to no earnings growth.
Conclusion
Overall, we would be extremely cautious before making any decision on Paik Kwang Industrial. The low ROE, combined with the fact that the company is paying out almost if not all, of its profits as dividends, has resulted in the lack or absence of growth in its earnings. Until now, we have only just grazed the surface of the company's past performance by looking at the company's fundamentals. You can do your own research on Paik Kwang Industrial and see how it has performed in the past by looking at this FREE detailed graph of past earnings, revenue and cash flows.
New: Manage All Your Stock Portfolios in One Place
We've created the ultimate portfolio companion for stock investors, and it's free.
• Connect an unlimited number of Portfolios and see your total in one currency
• Be alerted to new Warning Signs or Risks via email or mobile
• Track the Fair Value of your stocks
Have feedback on this article? Concerned about the content? Get in touch with us directly. Alternatively, email editorial-team (at) simplywallst.com.
This article by Simply Wall St is general in nature. We provide commentary based on historical data and analyst forecasts only using an unbiased methodology and our articles are not intended to be financial advice. It does not constitute a recommendation to buy or sell any stock, and does not take account of your objectives, or your financial situation. We aim to bring you long-term focused analysis driven by fundamental data. Note that our analysis may not factor in the latest price-sensitive company announcements or qualitative material. Simply Wall St has no position in any stocks mentioned.
Have feedback on this article? Concerned about the content? Get in touch with us directly. Alternatively, email editorial-team@simplywallst.com
About KOSE:A001340
Paik Kwang Industrial
Produces and sells chemical products in South Korea and internationally.
Very low with weak fundamentals.
Market Insights

Community Narratives
