
Advertisement
- South Korea
- /
- Chemicals
- /
- KOSDAQ:A332290
Returns On Capital Signal Difficult Times Ahead For Nousbo (KOSDAQ:332290)
What financial metrics can indicate to us that a company is maturing or even in decline? Businesses in decline often have two underlying trends, firstly, a declining return on capital employed (ROCE) and a declining base of capital employed. Ultimately this means that the company is earning less per dollar invested and on top of that, it's shrinking its base of capital employed. In light of that, from a first glance at Nousbo (KOSDAQ:332290), we've spotted some signs that it could be struggling, so let's investigate.
Return On Capital Employed (ROCE): What Is It?
If you haven't worked with ROCE before, it measures the 'return' (pre-tax profit) a company generates from capital employed in its business. To calculate this metric for Nousbo, this is the formula:
Return on Capital Employed = Earnings Before Interest and Tax (EBIT) ÷ (Total Assets - Current Liabilities)
0.0064 = ₩175m ÷ (₩84b - ₩57b) (Based on the trailing twelve months to June 2024).
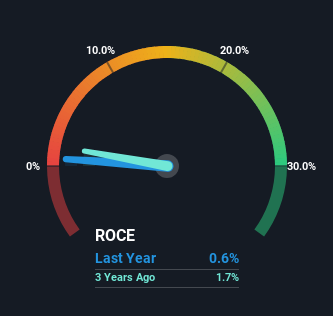
So, Nousbo has an ROCE of 0.6%. In absolute terms, that's a low return and it also under-performs the Chemicals industry average of 7.5%.
See our latest analysis for Nousbo
While the past is not representative of the future, it can be helpful to know how a company has performed historically, which is why we have this chart above. If you'd like to look at how Nousbo has performed in the past in other metrics, you can view this free graph of Nousbo's past earnings, revenue and cash flow.
What Can We Tell From Nousbo's ROCE Trend?
In terms of Nousbo's historical ROCE movements, the trend doesn't inspire confidence. To be more specific, the ROCE was 2.6% four years ago, but since then it has dropped noticeably. Meanwhile, capital employed in the business has stayed roughly the flat over the period. Since returns are falling and the business has the same amount of assets employed, this can suggest it's a mature business that hasn't had much growth in the last four years. If these trends continue, we wouldn't expect Nousbo to turn into a multi-bagger.
On a side note, Nousbo's current liabilities have increased over the last four years to 68% of total assets, effectively distorting the ROCE to some degree. Without this increase, it's likely that ROCE would be even lower than 0.6%. And with current liabilities at these levels, suppliers or short-term creditors are effectively funding a large part of the business, which can introduce some risks.
The Bottom Line On Nousbo's ROCE
All in all, the lower returns from the same amount of capital employed aren't exactly signs of a compounding machine. Long term shareholders who've owned the stock over the last year have experienced a 39% depreciation in their investment, so it appears the market might not like these trends either. That being the case, unless the underlying trends revert to a more positive trajectory, we'd consider looking elsewhere.
If you'd like to know more about Nousbo, we've spotted 2 warning signs, and 1 of them is a bit concerning.
For those who like to invest in solid companies, check out this free list of companies with solid balance sheets and high returns on equity.
Valuation is complex, but we're here to simplify it.
Discover if Nousbo might be undervalued or overvalued with our detailed analysis, featuring fair value estimates, potential risks, dividends, insider trades, and its financial condition.
Access Free AnalysisHave feedback on this article? Concerned about the content? Get in touch with us directly. Alternatively, email editorial-team (at) simplywallst.com.
This article by Simply Wall St is general in nature. We provide commentary based on historical data and analyst forecasts only using an unbiased methodology and our articles are not intended to be financial advice. It does not constitute a recommendation to buy or sell any stock, and does not take account of your objectives, or your financial situation. We aim to bring you long-term focused analysis driven by fundamental data. Note that our analysis may not factor in the latest price-sensitive company announcements or qualitative material. Simply Wall St has no position in any stocks mentioned.
About KOSDAQ:A332290
Nousbo
Develops, manufactures, and sells chemical fertilizers and pesticides in South Korea.
Acceptable track record with mediocre balance sheet.
Market Insights

Advertisement
Community Narratives
Finding The True Value Of A Logistics Powerhouse
Fair Value US$95.21|8.7% undervalued
NV
Community Contributor
Paradigm Biopharmaceuticals Will Lead Osteoarthritis Treatment with Zilosul's FDA Success
Fair Value AU$5.50|93.3% undervalued
AM
Community Contributor
Barrick Mining (ABX:CA): A Gold Hedge against a U.S. Shutdown
Fair Value CA$60.00|18.7% undervalued
GM
Community Contributor