
Advertisement
- South Korea
- /
- Chemicals
- /
- KOSDAQ:A065560
Nokwon Commercials & Industries' (KOSDAQ:065560) Returns On Capital Tell Us There Is Reason To Feel Uneasy

When researching a stock for investment, what can tell us that the company is in decline? Typically, we'll see the trend of both return on capital employed (ROCE) declining and this usually coincides with a decreasing amount of capital employed. This reveals that the company isn't compounding shareholder wealth because returns are falling and its net asset base is shrinking. So after glancing at the trends within Nokwon Commercials & Industries (KOSDAQ:065560), we weren't too hopeful.
What Is Return On Capital Employed (ROCE)?
Just to clarify if you're unsure, ROCE is a metric for evaluating how much pre-tax income (in percentage terms) a company earns on the capital invested in its business. To calculate this metric for Nokwon Commercials & Industries, this is the formula:
Return on Capital Employed = Earnings Before Interest and Tax (EBIT) ÷ (Total Assets - Current Liabilities)
0.017 = ₩938m ÷ (₩62b - ₩6.0b) (Based on the trailing twelve months to March 2024).
So, Nokwon Commercials & Industries has an ROCE of 1.7%. In absolute terms, that's a low return and it also under-performs the Chemicals industry average of 6.6%.
See our latest analysis for Nokwon Commercials & Industries
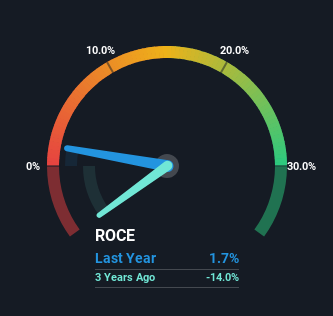
Historical performance is a great place to start when researching a stock so above you can see the gauge for Nokwon Commercials & Industries' ROCE against it's prior returns. If you'd like to look at how Nokwon Commercials & Industries has performed in the past in other metrics, you can view this free graph of Nokwon Commercials & Industries' past earnings, revenue and cash flow.
So How Is Nokwon Commercials & Industries' ROCE Trending?
In terms of Nokwon Commercials & Industries' historical ROCE trend, it isn't fantastic. Unfortunately, returns have declined substantially over the last five years to the 1.7% we see today. In addition to that, Nokwon Commercials & Industries is now employing 29% less capital than it was five years ago. The fact that both are shrinking is an indication that the business is going through some tough times. If these underlying trends continue, we wouldn't be too optimistic going forward.
On a related note, Nokwon Commercials & Industries has decreased its current liabilities to 9.6% of total assets. So we could link some of this to the decrease in ROCE. What's more, this can reduce some aspects of risk to the business because now the company's suppliers or short-term creditors are funding less of its operations. Some would claim this reduces the business' efficiency at generating ROCE since it is now funding more of the operations with its own money.
In Conclusion...
In summary, it's unfortunate that Nokwon Commercials & Industries is shrinking its capital base and also generating lower returns. We expect this has contributed to the stock plummeting 97% during the last five years. That being the case, unless the underlying trends revert to a more positive trajectory, we'd consider looking elsewhere.
On a final note, we found 4 warning signs for Nokwon Commercials & Industries (3 make us uncomfortable) you should be aware of.
While Nokwon Commercials & Industries may not currently earn the highest returns, we've compiled a list of companies that currently earn more than 25% return on equity. Check out this free list here.
Valuation is complex, but we're here to simplify it.
Discover if Nokwon Commercials & Industries might be undervalued or overvalued with our detailed analysis, featuring fair value estimates, potential risks, dividends, insider trades, and its financial condition.
Access Free AnalysisHave feedback on this article? Concerned about the content? Get in touch with us directly. Alternatively, email editorial-team (at) simplywallst.com.
This article by Simply Wall St is general in nature. We provide commentary based on historical data and analyst forecasts only using an unbiased methodology and our articles are not intended to be financial advice. It does not constitute a recommendation to buy or sell any stock, and does not take account of your objectives, or your financial situation. We aim to bring you long-term focused analysis driven by fundamental data. Note that our analysis may not factor in the latest price-sensitive company announcements or qualitative material. Simply Wall St has no position in any stocks mentioned.
Have feedback on this article? Concerned about the content? Get in touch with us directly. Alternatively, email editorial-team@simplywallst.com
About KOSDAQ:A065560
Flawless balance sheet and good value.
Market Insights

Advertisement
Community Narratives
MicroStrategy: Volatile Gamble or Golden Opportunity?
Fair Value US$663.00|31.9% undervalued
BL
Community Contributor
Emerging Markets and Debt Reduction Will Propel Bath & Body Works Forward
Fair Value US$40.73|22.1% undervalued
ZW
Community Contributor
An amazing opportunity to potentially get a 100 bagger
Fair Value US$10.00|36.0% overvalued
DA
Community Contributor