
Advertisement
- South Korea
- /
- Metals and Mining
- /
- KOSDAQ:A060380
The Returns At Dongyang S.TecLtd (KOSDAQ:060380) Provide Us With Signs Of What's To Come
If you're not sure where to start when looking for the next multi-bagger, there are a few key trends you should keep an eye out for. One common approach is to try and find a company with returns on capital employed (ROCE) that are increasing, in conjunction with a growing amount of capital employed. This shows us that it's a compounding machine, able to continually reinvest its earnings back into the business and generate higher returns. However, after briefly looking over the numbers, we don't think Dongyang S.TecLtd (KOSDAQ:060380) has the makings of a multi-bagger going forward, but let's have a look at why that may be.
Return On Capital Employed (ROCE): What is it?
Just to clarify if you're unsure, ROCE is a metric for evaluating how much pre-tax income (in percentage terms) a company earns on the capital invested in its business. The formula for this calculation on Dongyang S.TecLtd is:
Return on Capital Employed = Earnings Before Interest and Tax (EBIT) ÷ (Total Assets - Current Liabilities)
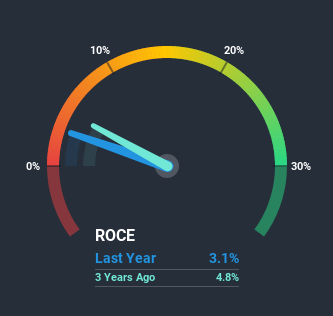
0.031 = ₩2.3b ÷ (₩128b - ₩55b) (Based on the trailing twelve months to September 2020).
Thus, Dongyang S.TecLtd has an ROCE of 3.1%. In absolute terms, that's a low return and it also under-performs the Metals and Mining industry average of 4.1%.
Check out our latest analysis for Dongyang S.TecLtd
While the past is not representative of the future, it can be helpful to know how a company has performed historically, which is why we have this chart above. If you're interested in investigating Dongyang S.TecLtd's past further, check out this free graph of past earnings, revenue and cash flow.
So How Is Dongyang S.TecLtd's ROCE Trending?
In terms of Dongyang S.TecLtd's historical ROCE movements, the trend isn't fantastic. To be more specific, ROCE has fallen from 5.1% over the last five years. And considering revenue has dropped while employing more capital, we'd be cautious. If this were to continue, you might be looking at a company that is trying to reinvest for growth but is actually losing market share since sales haven't increased.
On a separate but related note, it's important to know that Dongyang S.TecLtd has a current liabilities to total assets ratio of 43%, which we'd consider pretty high. This can bring about some risks because the company is basically operating with a rather large reliance on its suppliers or other sorts of short-term creditors. While it's not necessarily a bad thing, it can be beneficial if this ratio is lower.The Bottom Line On Dongyang S.TecLtd's ROCE
From the above analysis, we find it rather worrisome that returns on capital and sales for Dongyang S.TecLtd have fallen, meanwhile the business is employing more capital than it was five years ago. In spite of that, the stock has delivered a 22% return to shareholders who held over the last five years. Regardless, we don't like the trends as they are and if they persist, we think you might find better investments elsewhere.
Dongyang S.TecLtd does have some risks, we noticed 3 warning signs (and 1 which doesn't sit too well with us) we think you should know about.
If you want to search for solid companies with great earnings, check out this free list of companies with good balance sheets and impressive returns on equity.
When trading Dongyang S.TecLtd or any other investment, use the platform considered by many to be the Professional's Gateway to the Worlds Market, Interactive Brokers. You get the lowest-cost* trading on stocks, options, futures, forex, bonds and funds worldwide from a single integrated account. Promoted
New: Manage All Your Stock Portfolios in One Place
We've created the ultimate portfolio companion for stock investors, and it's free.
• Connect an unlimited number of Portfolios and see your total in one currency
• Be alerted to new Warning Signs or Risks via email or mobile
• Track the Fair Value of your stocks
This article by Simply Wall St is general in nature. It does not constitute a recommendation to buy or sell any stock, and does not take account of your objectives, or your financial situation. We aim to bring you long-term focused analysis driven by fundamental data. Note that our analysis may not factor in the latest price-sensitive company announcements or qualitative material. Simply Wall St has no position in any stocks mentioned.
*Interactive Brokers Rated Lowest Cost Broker by StockBrokers.com Annual Online Review 2020
Have feedback on this article? Concerned about the content? Get in touch with us directly. Alternatively, email editorial-team@simplywallst.com.
About KOSDAQ:A060380
Solid track record with excellent balance sheet.
Market Insights

Advertisement
Community Narratives
Finding The True Value Of A Logistics Powerhouse
Fair Value US$95.21|8.7% undervalued
NV
Community Contributor
Paradigm Biopharmaceuticals Will Lead Osteoarthritis Treatment with Zilosul's FDA Success
Fair Value AU$5.50|93.1% undervalued
AM
Community Contributor
Barrick Mining (ABX:CA): A Gold Hedge against a U.S. Shutdown
Fair Value CA$60.00|18.7% undervalued
GM
Community Contributor