
Advertisement
- South Korea
- /
- Chemicals
- /
- KOSDAQ:A042040
Subdued Growth No Barrier To KPM TECH Co., Ltd. (KOSDAQ:042040) With Shares Advancing 38%
Despite an already strong run, KPM TECH Co., Ltd. (KOSDAQ:042040) shares have been powering on, with a gain of 38% in the last thirty days. Unfortunately, despite the strong performance over the last month, the full year gain of 8.7% isn't as attractive.
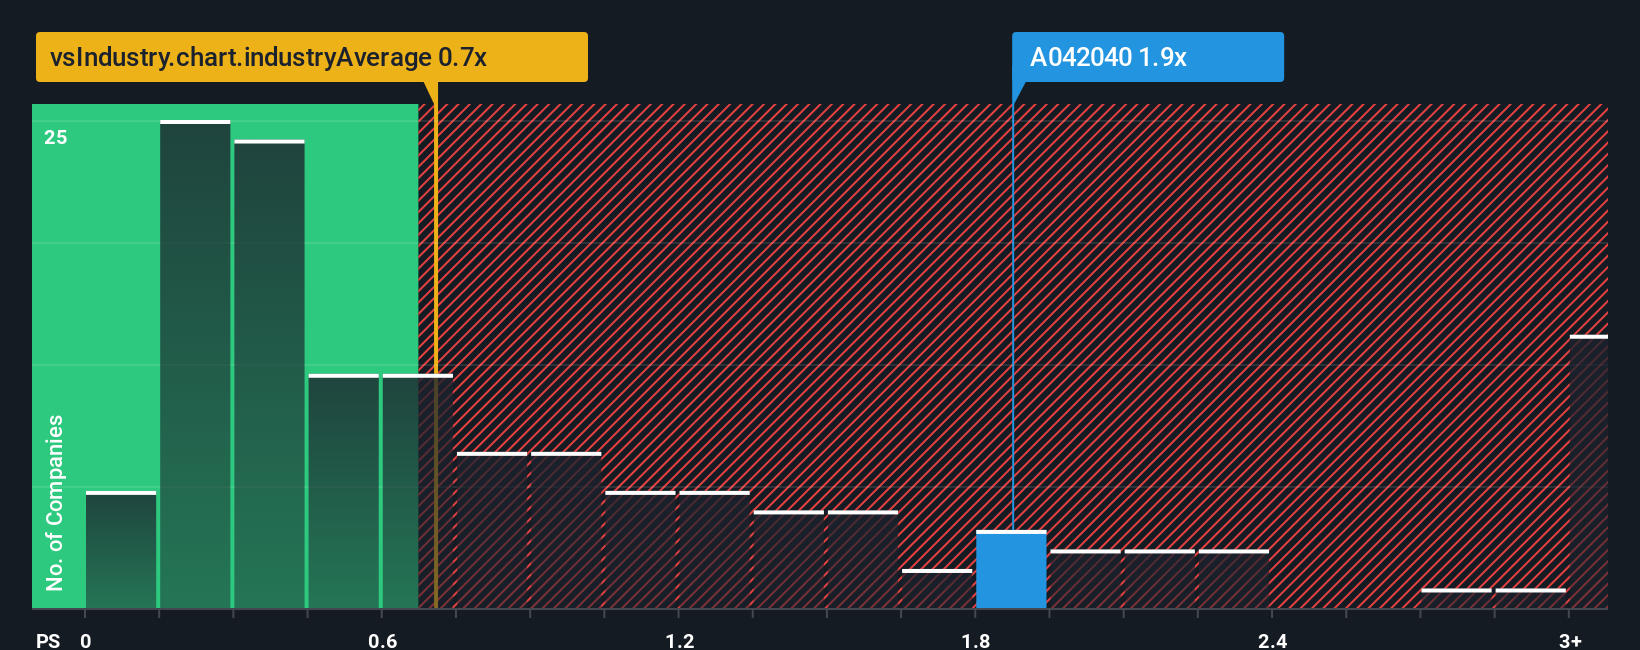
After such a large jump in price, you could be forgiven for thinking KPM TECH is a stock not worth researching with a price-to-sales ratios (or "P/S") of 1.9x, considering almost half the companies in Korea's Chemicals industry have P/S ratios below 0.7x. Nonetheless, we'd need to dig a little deeper to determine if there is a rational basis for the elevated P/S.
View our latest analysis for KPM TECH
What Does KPM TECH's Recent Performance Look Like?
As an illustration, revenue has deteriorated at KPM TECH over the last year, which is not ideal at all. Perhaps the market believes the company can do enough to outperform the rest of the industry in the near future, which is keeping the P/S ratio high. If not, then existing shareholders may be quite nervous about the viability of the share price.
Want the full picture on earnings, revenue and cash flow for the company? Then our free report on KPM TECH will help you shine a light on its historical performance.Is There Enough Revenue Growth Forecasted For KPM TECH?
In order to justify its P/S ratio, KPM TECH would need to produce impressive growth in excess of the industry.
Retrospectively, the last year delivered a frustrating 15% decrease to the company's top line. That put a dampener on the good run it was having over the longer-term as its three-year revenue growth is still a noteworthy 5.4% in total. Although it's been a bumpy ride, it's still fair to say the revenue growth recently has been mostly respectable for the company.
Comparing the recent medium-term revenue trends against the industry's one-year growth forecast of 9.3% shows it's noticeably less attractive.
With this in mind, we find it worrying that KPM TECH's P/S exceeds that of its industry peers. Apparently many investors in the company are way more bullish than recent times would indicate and aren't willing to let go of their stock at any price. There's a good chance existing shareholders are setting themselves up for future disappointment if the P/S falls to levels more in line with recent growth rates.
What Does KPM TECH's P/S Mean For Investors?
KPM TECH's P/S is on the rise since its shares have risen strongly. Typically, we'd caution against reading too much into price-to-sales ratios when settling on investment decisions, though it can reveal plenty about what other market participants think about the company.
The fact that KPM TECH currently trades on a higher P/S relative to the industry is an oddity, since its recent three-year growth is lower than the wider industry forecast. When we observe slower-than-industry revenue growth alongside a high P/S ratio, we assume there to be a significant risk of the share price decreasing, which would result in a lower P/S ratio. If recent medium-term revenue trends continue, it will place shareholders' investments at significant risk and potential investors in danger of paying an excessive premium.
Plus, you should also learn about these 2 warning signs we've spotted with KPM TECH.
If strong companies turning a profit tickle your fancy, then you'll want to check out this free list of interesting companies that trade on a low P/E (but have proven they can grow earnings).
Valuation is complex, but we're here to simplify it.
Discover if KPM TECH might be undervalued or overvalued with our detailed analysis, featuring fair value estimates, potential risks, dividends, insider trades, and its financial condition.
Access Free AnalysisHave feedback on this article? Concerned about the content? Get in touch with us directly. Alternatively, email editorial-team (at) simplywallst.com.
This article by Simply Wall St is general in nature. We provide commentary based on historical data and analyst forecasts only using an unbiased methodology and our articles are not intended to be financial advice. It does not constitute a recommendation to buy or sell any stock, and does not take account of your objectives, or your financial situation. We aim to bring you long-term focused analysis driven by fundamental data. Note that our analysis may not factor in the latest price-sensitive company announcements or qualitative material. Simply Wall St has no position in any stocks mentioned.
About KOSDAQ:A042040
Low risk and overvalued.
Market Insights

Advertisement
Community Narratives
The company that turned a verb into a global necessity and basically runs the modern internet, digital ads, smartphones, maps, and AI.
Fair Value US$300.00|6.2% undervalued
OS
Community Contributor
Flowers Foods Pays A Fair Price For Health
Fair Value US$16.12|25.1% undervalued
NV
Community Contributor
TMX Group will thrive with 33.3% profit margin and enduring market moat
Fair Value CA$49.90|0.04% overvalued
LI
Community Contributor