- South Korea
- /
- Personal Products
- /
- KOSDAQ:A234690
The Return Trends At GREEN CROSS WellBeing (KOSDAQ:234690) Look Promising


Finding a business that has the potential to grow substantially is not easy, but it is possible if we look at a few key financial metrics. One common approach is to try and find a company with returns on capital employed (ROCE) that are increasing, in conjunction with a growing amount of capital employed. If you see this, it typically means it's a company with a great business model and plenty of profitable reinvestment opportunities. So on that note, GREEN CROSS WellBeing (KOSDAQ:234690) looks quite promising in regards to its trends of return on capital.
What Is Return On Capital Employed (ROCE)?
Just to clarify if you're unsure, ROCE is a metric for evaluating how much pre-tax income (in percentage terms) a company earns on the capital invested in its business. Analysts use this formula to calculate it for GREEN CROSS WellBeing:
Return on Capital Employed = Earnings Before Interest and Tax (EBIT) ÷ (Total Assets - Current Liabilities)
0.09 = ₩9.7b ÷ (₩156b - ₩49b) (Based on the trailing twelve months to September 2023).
So, GREEN CROSS WellBeing has an ROCE of 9.0%. In absolute terms, that's a low return, but it's much better than the Personal Products industry average of 5.8%.
View our latest analysis for GREEN CROSS WellBeing
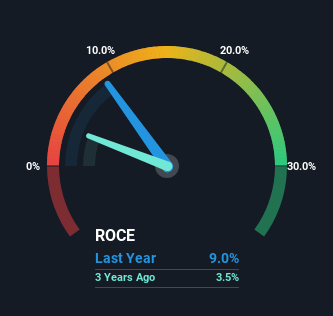
Historical performance is a great place to start when researching a stock so above you can see the gauge for GREEN CROSS WellBeing's ROCE against it's prior returns. If you'd like to look at how GREEN CROSS WellBeing has performed in the past in other metrics, you can view this free graph of GREEN CROSS WellBeing's past earnings, revenue and cash flow.
What The Trend Of ROCE Can Tell Us
GREEN CROSS WellBeing is showing promise given that its ROCE is trending up and to the right. The figures show that over the last three years, ROCE has grown 158% whilst employing roughly the same amount of capital. Basically the business is generating higher returns from the same amount of capital and that is proof that there are improvements in the company's efficiencies. The company is doing well in that sense, and it's worth investigating what the management team has planned for long term growth prospects.
For the record though, there was a noticeable increase in the company's current liabilities over the period, so we would attribute some of the ROCE growth to that. The current liabilities has increased to 31% of total assets, so the business is now more funded by the likes of its suppliers or short-term creditors. It's worth keeping an eye on this because as the percentage of current liabilities to total assets increases, some aspects of risk also increase.
The Key Takeaway
To sum it up, GREEN CROSS WellBeing is collecting higher returns from the same amount of capital, and that's impressive. Astute investors may have an opportunity here because the stock has declined 19% in the last three years. That being the case, research into the company's current valuation metrics and future prospects seems fitting.
One more thing to note, we've identified 2 warning signs with GREEN CROSS WellBeing and understanding these should be part of your investment process.
If you want to search for solid companies with great earnings, check out this free list of companies with good balance sheets and impressive returns on equity.
If you're looking to trade GREEN CROSS WellBeing, open an account with the lowest-cost platform trusted by professionals, Interactive Brokers.
With clients in over 200 countries and territories, and access to 160 markets, IBKR lets you trade stocks, options, futures, forex, bonds and funds from a single integrated account.
Enjoy no hidden fees, no account minimums, and FX conversion rates as low as 0.03%, far better than what most brokers offer.
Sponsored ContentNew: Manage All Your Stock Portfolios in One Place
We've created the ultimate portfolio companion for stock investors, and it's free.
• Connect an unlimited number of Portfolios and see your total in one currency
• Be alerted to new Warning Signs or Risks via email or mobile
• Track the Fair Value of your stocks
Have feedback on this article? Concerned about the content? Get in touch with us directly. Alternatively, email editorial-team (at) simplywallst.com.
This article by Simply Wall St is general in nature. We provide commentary based on historical data and analyst forecasts only using an unbiased methodology and our articles are not intended to be financial advice. It does not constitute a recommendation to buy or sell any stock, and does not take account of your objectives, or your financial situation. We aim to bring you long-term focused analysis driven by fundamental data. Note that our analysis may not factor in the latest price-sensitive company announcements or qualitative material. Simply Wall St has no position in any stocks mentioned.
About KOSDAQ:A234690
GREEN CROSS WellBeing
Provides personalized nutrition injections in South Korea.
Excellent balance sheet second-rate dividend payer.
Market Insights

Community Narratives

