
Advertisement
- South Korea
- /
- Personal Products
- /
- KOSDAQ:A234690
GREEN CROSS WellBeing Corporation's (KOSDAQ:234690) P/E Still Appears To Be Reasonable

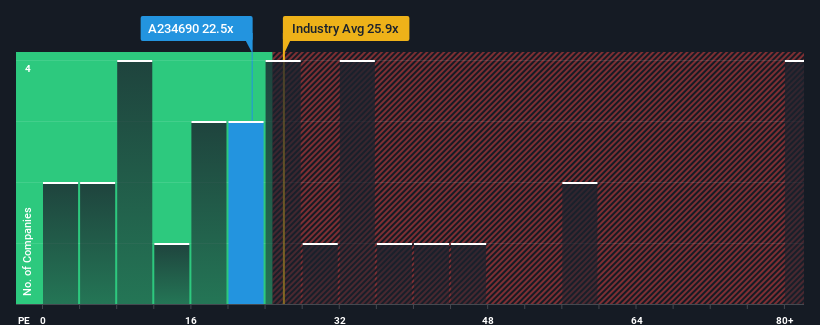
When close to half the companies in Korea have price-to-earnings ratios (or "P/E's") below 12x, you may consider GREEN CROSS WellBeing Corporation (KOSDAQ:234690) as a stock to avoid entirely with its 22.5x P/E ratio. Although, it's not wise to just take the P/E at face value as there may be an explanation why it's so lofty.
For example, consider that GREEN CROSS WellBeing's financial performance has been poor lately as its earnings have been in decline. One possibility is that the P/E is high because investors think the company will still do enough to outperform the broader market in the near future. You'd really hope so, otherwise you're paying a pretty hefty price for no particular reason.
See our latest analysis for GREEN CROSS WellBeing
How Is GREEN CROSS WellBeing's Growth Trending?
There's an inherent assumption that a company should far outperform the market for P/E ratios like GREEN CROSS WellBeing's to be considered reasonable.
Retrospectively, the last year delivered a frustrating 20% decrease to the company's bottom line. Still, the latest three year period has seen an excellent 267% overall rise in EPS, in spite of its unsatisfying short-term performance. Accordingly, while they would have preferred to keep the run going, shareholders would probably welcome the medium-term rates of earnings growth.
This is in contrast to the rest of the market, which is expected to grow by 33% over the next year, materially lower than the company's recent medium-term annualised growth rates.
With this information, we can see why GREEN CROSS WellBeing is trading at such a high P/E compared to the market. Presumably shareholders aren't keen to offload something they believe will continue to outmanoeuvre the bourse.
The Key Takeaway
It's argued the price-to-earnings ratio is an inferior measure of value within certain industries, but it can be a powerful business sentiment indicator.
As we suspected, our examination of GREEN CROSS WellBeing revealed its three-year earnings trends are contributing to its high P/E, given they look better than current market expectations. At this stage investors feel the potential for a deterioration in earnings isn't great enough to justify a lower P/E ratio. If recent medium-term earnings trends continue, it's hard to see the share price falling strongly in the near future under these circumstances.
The company's balance sheet is another key area for risk analysis. Take a look at our free balance sheet analysis for GREEN CROSS WellBeing with six simple checks on some of these key factors.
Of course, you might also be able to find a better stock than GREEN CROSS WellBeing. So you may wish to see this free collection of other companies that have reasonable P/E ratios and have grown earnings strongly.
New: Manage All Your Stock Portfolios in One Place
We've created the ultimate portfolio companion for stock investors, and it's free.
• Connect an unlimited number of Portfolios and see your total in one currency
• Be alerted to new Warning Signs or Risks via email or mobile
• Track the Fair Value of your stocks
Have feedback on this article? Concerned about the content? Get in touch with us directly. Alternatively, email editorial-team (at) simplywallst.com.
This article by Simply Wall St is general in nature. We provide commentary based on historical data and analyst forecasts only using an unbiased methodology and our articles are not intended to be financial advice. It does not constitute a recommendation to buy or sell any stock, and does not take account of your objectives, or your financial situation. We aim to bring you long-term focused analysis driven by fundamental data. Note that our analysis may not factor in the latest price-sensitive company announcements or qualitative material. Simply Wall St has no position in any stocks mentioned.
Have feedback on this article? Concerned about the content? Get in touch with us directly. Alternatively, email editorial-team@simplywallst.com
About KOSDAQ:A234690
GREEN CROSS WellBeing
Provides personalized nutrition injections in South Korea.
Excellent balance sheet second-rate dividend payer.
Market Insights

Advertisement
Community Narratives
Groundbreaking therapies that could change the treatment landscape for PTSD, fibromyalgia, MS & Alzheimer’s
Fair Value US$6.20|86.9% undervalued
CM
Community Contributor
DigitalOcean Will Grow 14% by Embracing AI with Paperspace Acquisition
Fair Value US$50.00|41.7% undervalued
NE
Community Contributor
Viant Technology: A Rising AdTech Challenger in the AI-Powered CTV Market
Fair Value US$38.61|63.2% undervalued
BL
Community Contributor
Volvo will Accelerate Forward into Electric and Autonomous Leadership in Five Years
Fair Value SEK 438.80|39.7% undervalued
UN
Community Contributor