
Advertisement
- South Korea
- /
- Personal Products
- /
- KOSDAQ:A226340
Bonne Co., Ltd.'s (KOSDAQ:226340) Stock is Soaring But Financials Seem Inconsistent: Will The Uptrend Continue?

Bonne (KOSDAQ:226340) has had a great run on the share market with its stock up by a significant 77% over the last three months. But the company's key financial indicators appear to be differing across the board and that makes us question whether or not the company's current share price momentum can be maintained. In this article, we decided to focus on Bonne's ROE.
Return on equity or ROE is an important factor to be considered by a shareholder because it tells them how effectively their capital is being reinvested. In short, ROE shows the profit each dollar generates with respect to its shareholder investments.
Check out our latest analysis for Bonne
How To Calculate Return On Equity?
The formula for return on equity is:
Return on Equity = Net Profit (from continuing operations) ÷ Shareholders' Equity
So, based on the above formula, the ROE for Bonne is:
3.6% = ₩1.7b ÷ ₩48b (Based on the trailing twelve months to March 2024).
The 'return' is the income the business earned over the last year. Another way to think of that is that for every ₩1 worth of equity, the company was able to earn ₩0.04 in profit.
What Is The Relationship Between ROE And Earnings Growth?
So far, we've learned that ROE is a measure of a company's profitability. Based on how much of its profits the company chooses to reinvest or "retain", we are then able to evaluate a company's future ability to generate profits. Generally speaking, other things being equal, firms with a high return on equity and profit retention, have a higher growth rate than firms that don’t share these attributes.
Bonne's Earnings Growth And 3.6% ROE
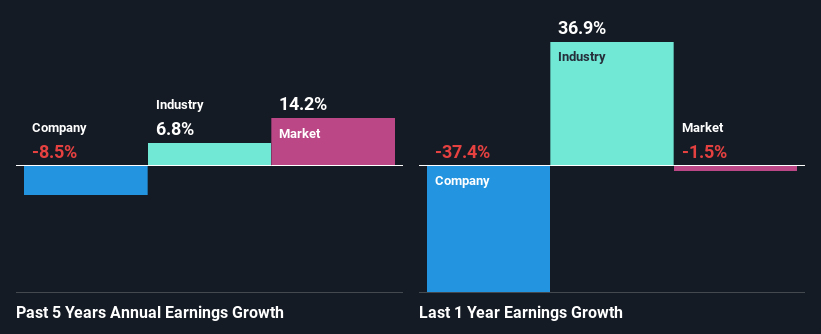
It is hard to argue that Bonne's ROE is much good in and of itself. Not just that, even compared to the industry average of 6.8%, the company's ROE is entirely unremarkable. Therefore, it might not be wrong to say that the five year net income decline of 8.5% seen by Bonne was possibly a result of it having a lower ROE. We reckon that there could also be other factors at play here. For example, the business has allocated capital poorly, or that the company has a very high payout ratio.
That being said, we compared Bonne's performance with the industry and were concerned when we found that while the company has shrunk its earnings, the industry has grown its earnings at a rate of 6.8% in the same 5-year period.
Earnings growth is a huge factor in stock valuation. The investor should try to establish if the expected growth or decline in earnings, whichever the case may be, is priced in. This then helps them determine if the stock is placed for a bright or bleak future. One good indicator of expected earnings growth is the P/E ratio which determines the price the market is willing to pay for a stock based on its earnings prospects. So, you may want to check if Bonne is trading on a high P/E or a low P/E, relative to its industry.
Is Bonne Using Its Retained Earnings Effectively?
Bonne doesn't pay any regular dividends, meaning that potentially all of its profits are being reinvested in the business, which doesn't explain why the company's earnings have shrunk if it is retaining all of its profits. So there might be other factors at play here which could potentially be hampering growth. For example, the business has faced some headwinds.
Conclusion
On the whole, we feel that the performance shown by Bonne can be open to many interpretations. While the company does have a high rate of profit retention, its low rate of return is probably hampering its earnings growth. Wrapping up, we would proceed with caution with this company and one way of doing that would be to look at the risk profile of the business. To know the 4 risks we have identified for Bonne visit our risks dashboard for free.
Valuation is complex, but we're here to simplify it.
Discover if Bonne might be undervalued or overvalued with our detailed analysis, featuring fair value estimates, potential risks, dividends, insider trades, and its financial condition.
Access Free AnalysisHave feedback on this article? Concerned about the content? Get in touch with us directly. Alternatively, email editorial-team (at) simplywallst.com.
This article by Simply Wall St is general in nature. We provide commentary based on historical data and analyst forecasts only using an unbiased methodology and our articles are not intended to be financial advice. It does not constitute a recommendation to buy or sell any stock, and does not take account of your objectives, or your financial situation. We aim to bring you long-term focused analysis driven by fundamental data. Note that our analysis may not factor in the latest price-sensitive company announcements or qualitative material. Simply Wall St has no position in any stocks mentioned.
About KOSDAQ:A226340
Excellent balance sheet and good value.
Market Insights

Advertisement
Community Narratives

BMW cruising ahead with new EVs and premium models to boost revenue 5%
Fair Value €135.07|44.5% undervalued
UN
Community Contributor
EU#2 - From Humble Beginnings to Global Powerhouse
Fair Value DKK 851.04|46.1% undervalued
TO
Community Contributor