
Advertisement
- South Korea
- /
- Diversified Financial
- /
- KOSDAQ:A950110
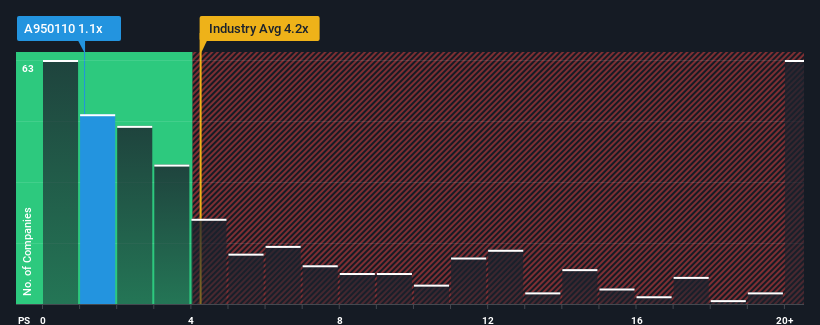
Investors Holding Back On SBI FinTech Solutions Co., Ltd. (KOSDAQ:950110)

There wouldn't be many who think SBI FinTech Solutions Co., Ltd.'s (KOSDAQ:950110) price-to-sales (or "P/S") ratio of 1.1x is worth a mention when the median P/S for the Diversified Financial industry in Korea is similar at about 0.9x. Although, it's not wise to simply ignore the P/S without explanation as investors may be disregarding a distinct opportunity or a costly mistake.
Check out our latest analysis for SBI FinTech Solutions
How Has SBI FinTech Solutions Performed Recently?
We'd have to say that with no tangible growth over the last year, SBI FinTech Solutions' revenue has been unimpressive. It might be that many expect the uninspiring revenue performance to only match most other companies at best over the coming period, which has kept the P/S from rising. If you like the company, you'd be hoping this isn't the case so that you could potentially pick up some stock while it's not quite in favour.
Want the full picture on earnings, revenue and cash flow for the company? Then our free report on SBI FinTech Solutions will help you shine a light on its historical performance.What Are Revenue Growth Metrics Telling Us About The P/S?
SBI FinTech Solutions' P/S ratio would be typical for a company that's only expected to deliver moderate growth, and importantly, perform in line with the industry.
Taking a look back first, we see that there was hardly any revenue growth to speak of for the company over the past year. This isn't what shareholders were looking for as it means they've been left with a 49% decline in revenue over the last three years in total. Therefore, it's fair to say the revenue growth recently has been undesirable for the company.
Weighing that medium-term revenue trajectory against the broader industry's one-year forecast for a contraction of 52% shows the industry is even less attractive on an annualised basis.
With this information, it's perhaps curious but not a major surprise that SBI FinTech Solutions is trading at a fairly similar P/S in comparison. Even if the company's recent growth rates continue outperforming the industry, shrinking revenues are unlikely to lead to a stable P/S long-term. Even just maintaining these prices will be difficult to achieve as recent revenue trends are already weighing down the shares.
The Key Takeaway
We'd say the price-to-sales ratio's power isn't primarily as a valuation instrument but rather to gauge current investor sentiment and future expectations.
We've established that SBI FinTech Solutions currently trades on a slightly lower than expected P/S if you consider its recent three-year revenues aren't as bad as the forecasts for a struggling industry. When we see less revenue decline than the industry but a P/S that's only on par, we assume potential risks are what might be placing pressure on the P/S ratio. Perhaps investors have reservations about the company's ability to sustain this level of performance amidst the challenging industry conditions. At least the risk of a price drop looks to be subdued, but investors seem to think future revenue could see some volatility.
It's always necessary to consider the ever-present spectre of investment risk. We've identified 5 warning signs with SBI FinTech Solutions (at least 1 which is significant), and understanding them should be part of your investment process.
If these risks are making you reconsider your opinion on SBI FinTech Solutions, explore our interactive list of high quality stocks to get an idea of what else is out there.
New: Manage All Your Stock Portfolios in One Place
We've created the ultimate portfolio companion for stock investors, and it's free.
• Connect an unlimited number of Portfolios and see your total in one currency
• Be alerted to new Warning Signs or Risks via email or mobile
• Track the Fair Value of your stocks
Have feedback on this article? Concerned about the content? Get in touch with us directly. Alternatively, email editorial-team (at) simplywallst.com.
This article by Simply Wall St is general in nature. We provide commentary based on historical data and analyst forecasts only using an unbiased methodology and our articles are not intended to be financial advice. It does not constitute a recommendation to buy or sell any stock, and does not take account of your objectives, or your financial situation. We aim to bring you long-term focused analysis driven by fundamental data. Note that our analysis may not factor in the latest price-sensitive company announcements or qualitative material. Simply Wall St has no position in any stocks mentioned.
Have feedback on this article? Concerned about the content? Get in touch with us directly. Alternatively, email editorial-team@simplywallst.com
About KOSDAQ:A950110
SBI FinTech Solutions
A fintech solution company, payment agency service and international remittance services in Japan.
Mediocre balance sheet very low.
Market Insights

Advertisement
Community Narratives
Groundbreaking therapies that could change the treatment landscape for PTSD, fibromyalgia, MS & Alzheimer’s
Fair Value US$6.20|86.8% undervalued
CM
Community Contributor
DigitalOcean Will Grow 14% by Embracing AI with Paperspace Acquisition
Fair Value US$50.00|43.5% undervalued
NE
Community Contributor
Viant Technology: A Rising AdTech Challenger in the AI-Powered CTV Market
Fair Value US$38.61|61.4% undervalued
BL
Community Contributor
Volvo will Accelerate Forward into Electric and Autonomous Leadership in Five Years
Fair Value SEK 438.80|40.9% undervalued
UN
Community Contributor