- South Korea
- /
- Capital Markets
- /
- KOSDAQ:A027360
If You Had Bought Aju IB Investment (KOSDAQ:027360) Stock A Year Ago, You Could Pocket A 224% Gain Today


The most you can lose on any stock (assuming you don't use leverage) is 100% of your money. But if you pick the right business to buy shares in, you can make more than you can lose. For example, the Aju IB Investment Co., Ltd. (KOSDAQ:027360) share price has soared 224% in the last year. Most would be very happy with that, especially in just one year! Also pleasing for shareholders was the 195% gain in the last three months. This could be related to the recent financial results, released recently - you can catch up on the most recent data by reading our company report. We'll need to follow Aju IB Investment for a while to get a better sense of its share price trend, since it hasn't been listed for particularly long.
Check out our latest analysis for Aju IB Investment
While markets are a powerful pricing mechanism, share prices reflect investor sentiment, not just underlying business performance. By comparing earnings per share (EPS) and share price changes over time, we can get a feel for how investor attitudes to a company have morphed over time.
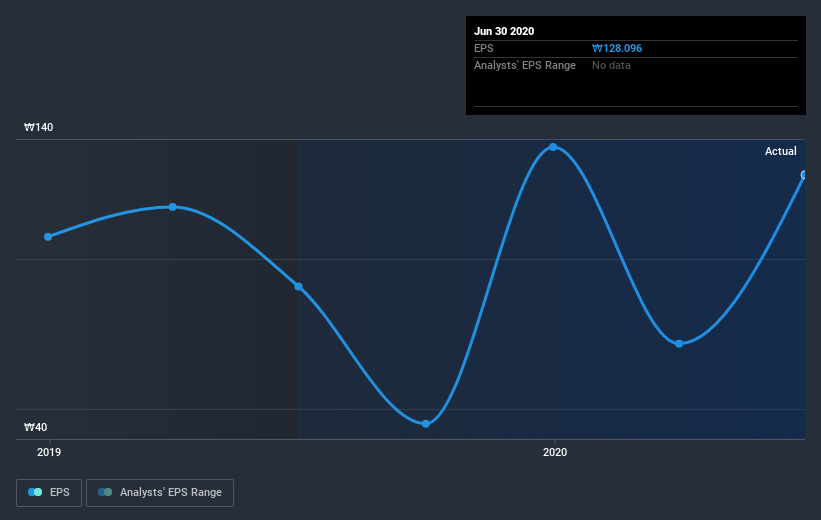
During the last year Aju IB Investment grew its earnings per share (EPS) by 42%. This EPS growth is significantly lower than the 224% increase in the share price. So it's fair to assume the market has a higher opinion of the business than it a year ago.
The company's earnings per share (over time) is depicted in the image below (click to see the exact numbers).
It might be well worthwhile taking a look at our free report on Aju IB Investment's earnings, revenue and cash flow.
What About Dividends?
When looking at investment returns, it is important to consider the difference between total shareholder return (TSR) and share price return. The TSR is a return calculation that accounts for the value of cash dividends (assuming that any dividend received was reinvested) and the calculated value of any discounted capital raisings and spin-offs. So for companies that pay a generous dividend, the TSR is often a lot higher than the share price return. In the case of Aju IB Investment, it has a TSR of 233% for the last year. That exceeds its share price return that we previously mentioned. And there's no prize for guessing that the dividend payments largely explain the divergence!
A Different Perspective
Aju IB Investment shareholders should be happy with the total gain of 233% over the last twelve months, including dividends. And the share price momentum remains respectable, with a gain of 195% in the last three months. This suggests the company is continuing to win over new investors. I find it very interesting to look at share price over the long term as a proxy for business performance. But to truly gain insight, we need to consider other information, too. Even so, be aware that Aju IB Investment is showing 3 warning signs in our investment analysis , you should know about...
But note: Aju IB Investment may not be the best stock to buy. So take a peek at this free list of interesting companies with past earnings growth (and further growth forecast).
Please note, the market returns quoted in this article reflect the market weighted average returns of stocks that currently trade on KR exchanges.
When trading Aju IB Investment or any other investment, use the platform considered by many to be the Professional's Gateway to the Worlds Market, Interactive Brokers. You get the lowest-cost* trading on stocks, options, futures, forex, bonds and funds worldwide from a single integrated account. Promoted
New: Manage All Your Stock Portfolios in One Place
We've created the ultimate portfolio companion for stock investors, and it's free.
• Connect an unlimited number of Portfolios and see your total in one currency
• Be alerted to new Warning Signs or Risks via email or mobile
• Track the Fair Value of your stocks
This article by Simply Wall St is general in nature. It does not constitute a recommendation to buy or sell any stock, and does not take account of your objectives, or your financial situation. We aim to bring you long-term focused analysis driven by fundamental data. Note that our analysis may not factor in the latest price-sensitive company announcements or qualitative material. Simply Wall St has no position in any stocks mentioned.
*Interactive Brokers Rated Lowest Cost Broker by StockBrokers.com Annual Online Review 2020
Have feedback on this article? Concerned about the content? Get in touch with us directly. Alternatively, email editorial-team@simplywallst.com.
About KOSDAQ:A027360
AJU IB INVESTMENT
A venture capital and private equity arm of AJU Corporation Co., Ltd.
Excellent balance sheet moderate.

