
Advertisement
- South Korea
- /
- Luxury
- /
- KOSE:A011300
Seong An Materials Co.,Ltd (KRX:011300) May Have Run Too Fast Too Soon With Recent 25% Price Plummet
Seong An Materials Co.,Ltd (KRX:011300) shareholders won't be pleased to see that the share price has had a very rough month, dropping 25% and undoing the prior period's positive performance. The drop over the last 30 days has capped off a tough year for shareholders, with the share price down 49% in that time.
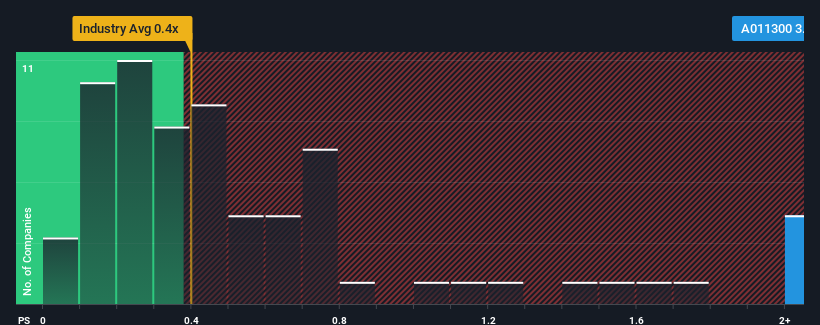
Even after such a large drop in price, you could still be forgiven for thinking Seong An MaterialsLtd is a stock to steer clear of with a price-to-sales ratios (or "P/S") of 3.3x, considering almost half the companies in Korea's Luxury industry have P/S ratios below 0.4x. However, the P/S might be quite high for a reason and it requires further investigation to determine if it's justified.
Check out our latest analysis for Seong An MaterialsLtd
How Seong An MaterialsLtd Has Been Performing
For example, consider that Seong An MaterialsLtd's financial performance has been poor lately as its revenue has been in decline. Perhaps the market believes the company can do enough to outperform the rest of the industry in the near future, which is keeping the P/S ratio high. You'd really hope so, otherwise you're paying a pretty hefty price for no particular reason.
Want the full picture on earnings, revenue and cash flow for the company? Then our free report on Seong An MaterialsLtd will help you shine a light on its historical performance.Is There Enough Revenue Growth Forecasted For Seong An MaterialsLtd?
Seong An MaterialsLtd's P/S ratio would be typical for a company that's expected to deliver very strong growth, and importantly, perform much better than the industry.
Taking a look back first, the company's revenue growth last year wasn't something to get excited about as it posted a disappointing decline of 51%. This means it has also seen a slide in revenue over the longer-term as revenue is down 78% in total over the last three years. So unfortunately, we have to acknowledge that the company has not done a great job of growing revenue over that time.
Weighing that medium-term revenue trajectory against the broader industry's one-year forecast for expansion of 6.6% shows it's an unpleasant look.
In light of this, it's alarming that Seong An MaterialsLtd's P/S sits above the majority of other companies. It seems most investors are ignoring the recent poor growth rate and are hoping for a turnaround in the company's business prospects. Only the boldest would assume these prices are sustainable as a continuation of recent revenue trends is likely to weigh heavily on the share price eventually.
What Does Seong An MaterialsLtd's P/S Mean For Investors?
Seong An MaterialsLtd's shares may have suffered, but its P/S remains high. Generally, our preference is to limit the use of the price-to-sales ratio to establishing what the market thinks about the overall health of a company.
Our examination of Seong An MaterialsLtd revealed its shrinking revenue over the medium-term isn't resulting in a P/S as low as we expected, given the industry is set to grow. When we see revenue heading backwards and underperforming the industry forecasts, we feel the possibility of the share price declining is very real, bringing the P/S back into the realm of reasonability. If recent medium-term revenue trends continue, it will place shareholders' investments at significant risk and potential investors in danger of paying an excessive premium.
You should always think about risks. Case in point, we've spotted 3 warning signs for Seong An MaterialsLtd you should be aware of.
If you're unsure about the strength of Seong An MaterialsLtd's business, why not explore our interactive list of stocks with solid business fundamentals for some other companies you may have missed.
New: Manage All Your Stock Portfolios in One Place
We've created the ultimate portfolio companion for stock investors, and it's free.
• Connect an unlimited number of Portfolios and see your total in one currency
• Be alerted to new Warning Signs or Risks via email or mobile
• Track the Fair Value of your stocks
Have feedback on this article? Concerned about the content? Get in touch with us directly. Alternatively, email editorial-team (at) simplywallst.com.
This article by Simply Wall St is general in nature. We provide commentary based on historical data and analyst forecasts only using an unbiased methodology and our articles are not intended to be financial advice. It does not constitute a recommendation to buy or sell any stock, and does not take account of your objectives, or your financial situation. We aim to bring you long-term focused analysis driven by fundamental data. Note that our analysis may not factor in the latest price-sensitive company announcements or qualitative material. Simply Wall St has no position in any stocks mentioned.
Have feedback on this article? Concerned about the content? Get in touch with us directly. Alternatively, email editorial-team@simplywallst.com
About KOSE:A011300
Seong An MaterialsLtd
A textile company, manufactures, exports, and sells fabric related products in Korea and internationally.
Moderate risk with imperfect balance sheet.
Market Insights

Advertisement
Community Narratives
Kodiak AI - a potential 100 bagger opportunity?
Fair Value US$14.00|44.7% undervalued
DA
Community Contributor
A Fair Price for a Great Business Facing Real Threats
Fair Value US$383.06|13.0% undervalued
IM
Community Contributor
AXON And Shopify Integration Will Unlock Global Mobile Advertising
Fair Value US$646.30|0% overvalued
AN
Based on Analyst Price Targets