
Advertisement
- South Korea
- /
- Luxury
- /
- KOSE:A009270
Optimism for ShinWon (KRX:009270) has grown this past week, despite one-year decline in earnings
These days it's easy to simply buy an index fund, and your returns should (roughly) match the market. But one can do better than that by picking better than average stocks (as part of a diversified portfolio). To wit, the ShinWon Corporation (KRX:009270) share price is 45% higher than it was a year ago, much better than the market return of around 13% (not including dividends) in the same period. That's a solid performance by our standards! Unfortunately the longer term returns are not so good, with the stock falling 2.4% in the last three years.
The past week has proven to be lucrative for ShinWon investors, so let's see if fundamentals drove the company's one-year performance.
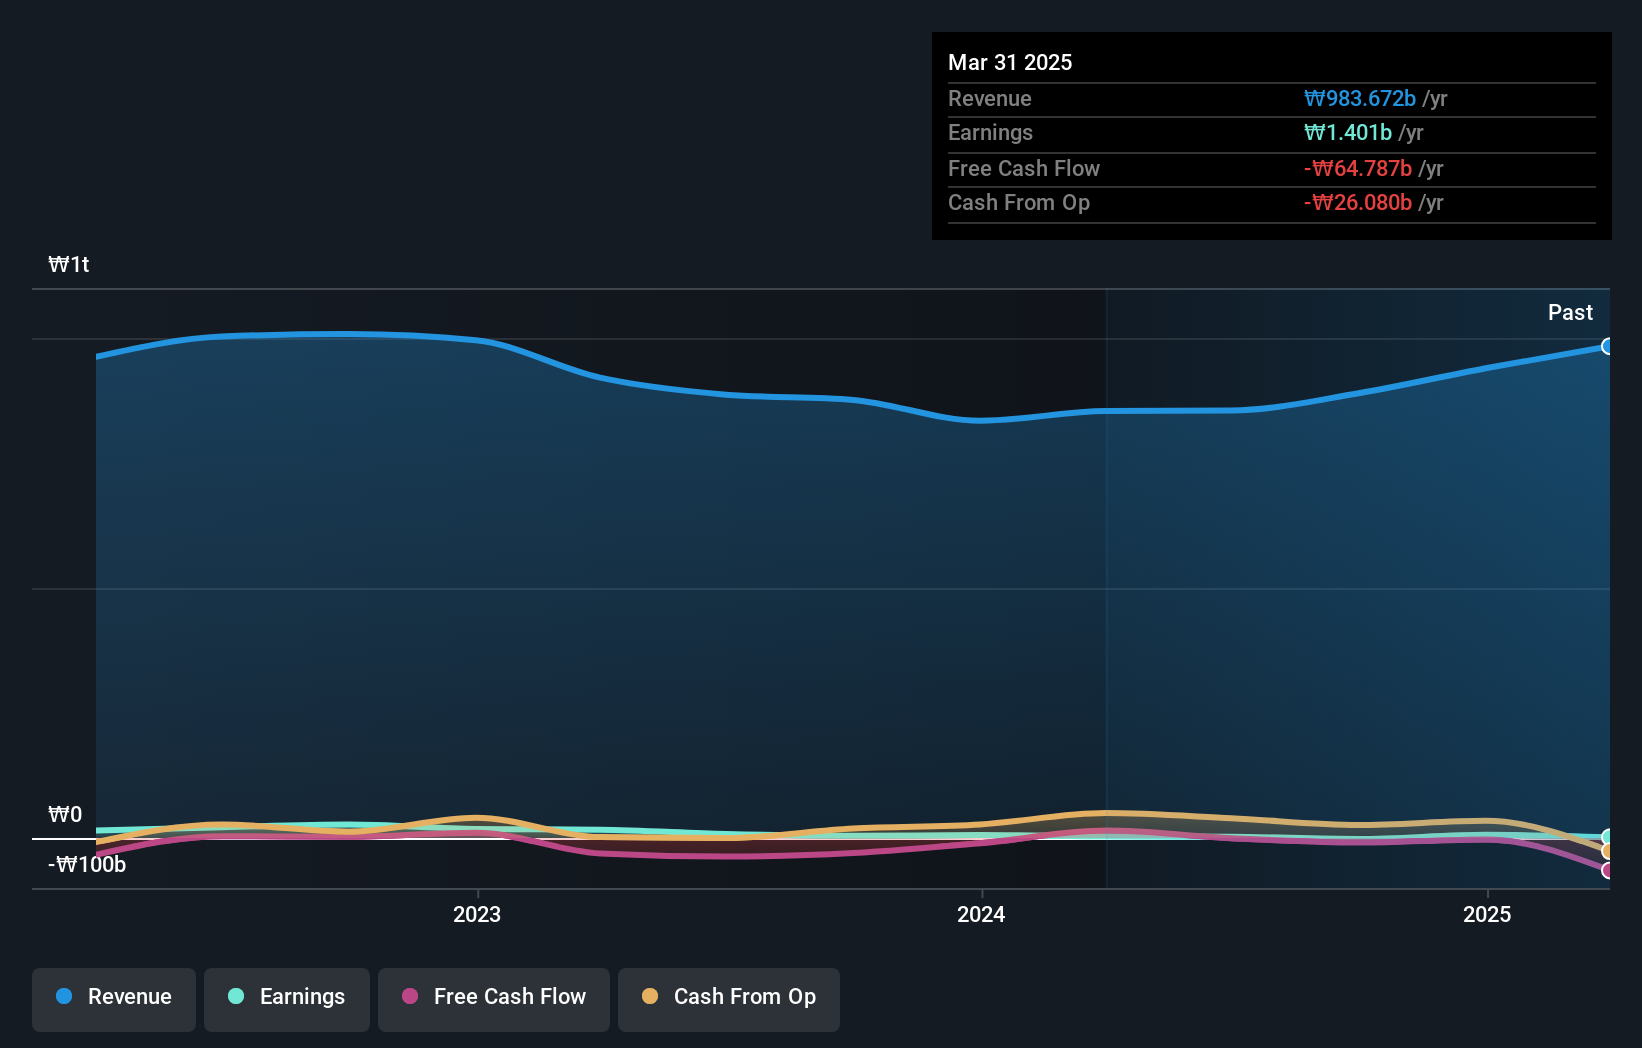
We don't think that ShinWon's modest trailing twelve month profit has the market's full attention at the moment. We think revenue is probably a better guide. Generally speaking, we'd consider a stock like this alongside loss-making companies, simply because the quantum of the profit is so low. It would be hard to believe in a more profitable future without growing revenues.
In the last year ShinWon saw its revenue grow by 15%. That's a fairly respectable growth rate. Buyers pushed the share price 45% in response, which isn't unreasonable. If the company can maintain the revenue growth, the share price could go higher still. But before deciding this growth stock is underappreciated, you might want to check out profitability trends (and cash flow)
The image below shows how earnings and revenue have tracked over time (if you click on the image you can see greater detail).
You can see how its balance sheet has strengthened (or weakened) over time in this free interactive graphic.
What About Dividends?
When looking at investment returns, it is important to consider the difference between total shareholder return (TSR) and share price return. The TSR incorporates the value of any spin-offs or discounted capital raisings, along with any dividends, based on the assumption that the dividends are reinvested. So for companies that pay a generous dividend, the TSR is often a lot higher than the share price return. We note that for ShinWon the TSR over the last 1 year was 52%, which is better than the share price return mentioned above. And there's no prize for guessing that the dividend payments largely explain the divergence!
A Different Perspective
It's nice to see that ShinWon shareholders have received a total shareholder return of 52% over the last year. And that does include the dividend. That's better than the annualised return of 5% over half a decade, implying that the company is doing better recently. In the best case scenario, this may hint at some real business momentum, implying that now could be a great time to delve deeper. It's always interesting to track share price performance over the longer term. But to understand ShinWon better, we need to consider many other factors. For example, we've discovered 4 warning signs for ShinWon (2 are a bit unpleasant!) that you should be aware of before investing here.
If you like to buy stocks alongside management, then you might just love this free list of companies. (Hint: many of them are unnoticed AND have attractive valuation).
Please note, the market returns quoted in this article reflect the market weighted average returns of stocks that currently trade on South Korean exchanges.
New: Manage All Your Stock Portfolios in One Place
We've created the ultimate portfolio companion for stock investors, and it's free.
• Connect an unlimited number of Portfolios and see your total in one currency
• Be alerted to new Warning Signs or Risks via email or mobile
• Track the Fair Value of your stocks
Have feedback on this article? Concerned about the content? Get in touch with us directly. Alternatively, email editorial-team (at) simplywallst.com.
This article by Simply Wall St is general in nature. We provide commentary based on historical data and analyst forecasts only using an unbiased methodology and our articles are not intended to be financial advice. It does not constitute a recommendation to buy or sell any stock, and does not take account of your objectives, or your financial situation. We aim to bring you long-term focused analysis driven by fundamental data. Note that our analysis may not factor in the latest price-sensitive company announcements or qualitative material. Simply Wall St has no position in any stocks mentioned.
About KOSE:A009270
ShinWon
Produces and sells men's wear, women's wear, casual, sports, and accessories in South Korea.
Low risk and slightly overvalued.
Market Insights

Advertisement
Community Narratives
MINISO's fair value is projected at 26.69 with an anticipated PE ratio shift of 20x
Fair Value US$24.03|11.0% undervalued
BE
Community Contributor
Procter & Gamble: A Dividend Giant Facing Slowing Growth
Fair Value US$119.81|23.3% overvalued
AN
Community Contributor
Eli Lilly's Future Growth Driven by Tirzepatide and Favorable Market Conditions
Fair Value US$1.19k|13.8% undervalued
EA
Community Contributor