
Advertisement
- South Korea
- /
- Luxury
- /
- KOSDAQ:A306040
SJ Group (KOSDAQ:306040) Strong Profits May Be Masking Some Underlying Issues
SJ Group Co., Ltd.'s (KOSDAQ:306040) healthy profit numbers didn't contain any surprises for investors. We believe that shareholders have noticed some concerning factors beyond the statutory profit numbers.
View our latest analysis for SJ Group
A Closer Look At SJ Group's Earnings
One key financial ratio used to measure how well a company converts its profit to free cash flow (FCF) is the accrual ratio. The accrual ratio subtracts the FCF from the profit for a given period, and divides the result by the average operating assets of the company over that time. You could think of the accrual ratio from cashflow as the 'non-FCF profit ratio'.
As a result, a negative accrual ratio is a positive for the company, and a positive accrual ratio is a negative. While it's not a problem to have a positive accrual ratio, indicating a certain level of non-cash profits, a high accrual ratio is arguably a bad thing, because it indicates paper profits are not matched by cash flow. Notably, there is some academic evidence that suggests that a high accrual ratio is a bad sign for near-term profits, generally speaking.
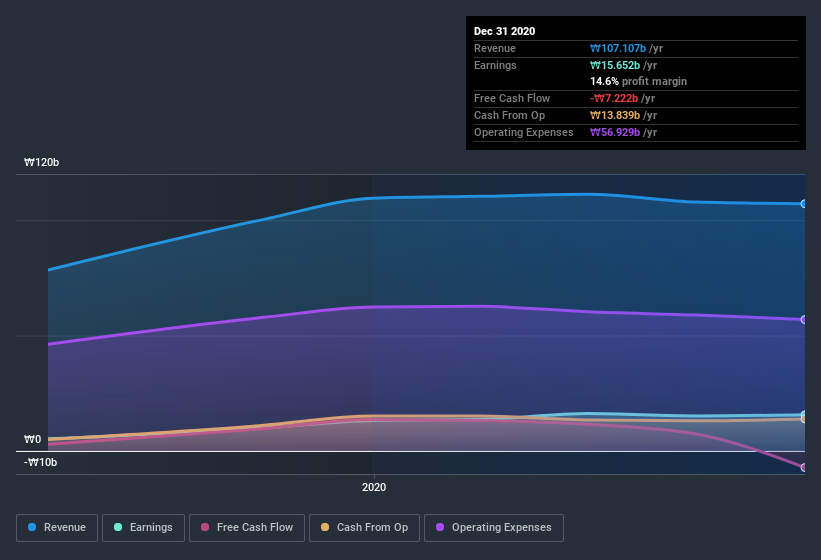
SJ Group has an accrual ratio of 0.68 for the year to December 2020. As a general rule, that bodes poorly for future profitability. To wit, the company did not generate one whit of free cashflow in that time. Even though it reported a profit of ₩15.7b, a look at free cash flow indicates it actually burnt through ₩7.2b in the last year. It's worth noting that SJ Group generated positive FCF of ₩14b a year ago, so at least they've done it in the past. The good news for shareholders is that SJ Group's accrual ratio was much better last year, so this year's poor reading might simply be a case of a short term mismatch between profit and FCF. As a result, some shareholders may be looking for stronger cash conversion in the current year.
That might leave you wondering what analysts are forecasting in terms of future profitability. Luckily, you can click here to see an interactive graph depicting future profitability, based on their estimates.
Our Take On SJ Group's Profit Performance
As we have made quite clear, we're a bit worried that SJ Group didn't back up the last year's profit with free cashflow. For this reason, we think that SJ Group's statutory profits may be a bad guide to its underlying earnings power, and might give investors an overly positive impression of the company. In further bad news, its earnings per share decreased in the last year. Of course, we've only just scratched the surface when it comes to analysing its earnings; one could also consider margins, forecast growth, and return on investment, among other factors. If you'd like to know more about SJ Group as a business, it's important to be aware of any risks it's facing. Every company has risks, and we've spotted 2 warning signs for SJ Group (of which 1 is a bit concerning!) you should know about.
This note has only looked at a single factor that sheds light on the nature of SJ Group's profit. But there is always more to discover if you are capable of focussing your mind on minutiae. For example, many people consider a high return on equity as an indication of favorable business economics, while others like to 'follow the money' and search out stocks that insiders are buying. So you may wish to see this free collection of companies boasting high return on equity, or this list of stocks that insiders are buying.
If you’re looking to trade SJ Group, open an account with the lowest-cost* platform trusted by professionals, Interactive Brokers. Their clients from over 200 countries and territories trade stocks, options, futures, forex, bonds and funds worldwide from a single integrated account. Promoted
New: Manage All Your Stock Portfolios in One Place
We've created the ultimate portfolio companion for stock investors, and it's free.
• Connect an unlimited number of Portfolios and see your total in one currency
• Be alerted to new Warning Signs or Risks via email or mobile
• Track the Fair Value of your stocks
This article by Simply Wall St is general in nature. It does not constitute a recommendation to buy or sell any stock, and does not take account of your objectives, or your financial situation. We aim to bring you long-term focused analysis driven by fundamental data. Note that our analysis may not factor in the latest price-sensitive company announcements or qualitative material. Simply Wall St has no position in any stocks mentioned.
*Interactive Brokers Rated Lowest Cost Broker by StockBrokers.com Annual Online Review 2020
Have feedback on this article? Concerned about the content? Get in touch with us directly. Alternatively, email editorial-team (at) simplywallst.com.
About KOSDAQ:A306040
SJ Group
Manufactures and sells backpacks, hats, children's clothing, innerwear, and women's wear.
Fair value with mediocre balance sheet.
Market Insights

Advertisement
Community Narratives
The "Molecular Pencil": Why Beam's Technology is Built to Win
Fair Value US$65.01|65.4% undervalued
DA
Community Contributor
The silent giant behind virtually every advanced chip powering AI, smartphones, and modern infrastructure.
Fair Value US$310.00|6.1% undervalued
OS
Community Contributor
ADP Stock: Solid Fundamentals, But AI Investments Test Its Margin Resilience
Fair Value US$387.77|34.2% undervalued
YI
Community Contributor
MINISO's fair value is projected at 26.69 with an anticipated PE ratio shift of 20x
Fair Value US$24.03|9.6% undervalued
BE
Community Contributor